Walkthrough: Watch your Ansible deployments in Grafana !
A few months ago our friends Guillaume Lefevre and Etienne Coutaud made an appearance at the 2017 KubeCon to present their work on a monitoring solution based on Prometheus and Grafana. (The video can be found here)
A bit over a month later, we faced a problem in production, the platform started to behave abnormally.
The graphs showed bursts in metrics which was unusual and some people were wondering if a deployment could have changed something in the configuration and triggered the problem.
Even if we had a lot of probes in the different stacks of the solution, it appeared that a critical operation such as a deployment was totally invisible in the Grafana dashboard. We could only see the impact on the graph, but there was no mention of an operation.
Luckily, Grafana has an awesome feature that would answer perfectly our need: the annotations.
Grafana annotations
What are annotations you say ? A picture is worth a thousand words:
 Credit: grafana.org
From the Grafana online documentation:
Annotations provide a way to mark points on the graph with rich events. When you hover over an annotation you can get event description and event tags. The text field can include links to other systems with more detail.
As all our deployments are performed through Ansible, the idea is to have Ansible create an annotation in Grafana everytime a playbook is executed.
The Pushgateway is not an event store
We started to look at how we could push events to Prometheus through the Push Gateway and display them as annotations in Grafana, but as soon as we went to the PushGateway readme we found a message which seemed addressed to us:
The Pushgateway is not an event store. While you can use Prometheus as a data source for Grafana annotations, tracking something like release events has to happen with some event-logging framework.
With that immediate stop on our idea, we delayed the topic as it wasn’t in the project’s critical path, but we kept it in mind as a “nice to have” feature.
After some time, I found myself browsing the Grafana documentation, and found out that Grafana 4.6+ now comes with an HTTP API allowing to store the annotation natively, meaning no need to store anything in Prometheus.
As soon as we got the news, we came back on the topic and started thinking about how we should implement the solution.
Annotations from Ansible
How can we interact with this brand new API from Ansible ? We identified 3 possibilities:
Solution 1: Ansible URI module in the playbooks
Since we are dealing with a HTTP API, the first solution coming to our mind was to use the Ansible URI module that would allow us to send the appropriate HTTP request to the Grafana endpoint.
But it also means that we have to update all our playbooks and find a way to avoid breaking their idempotency, so it may look trivial but it can result in several lines of yaml.
Solution 2: Dedicated Ansible module
We thought about writing an Ansible module, mostly to try to handle the idempotency problem in the module and keep the yaml short.
Solution 3: Dedicated Ansible callback
An Ansible callback would allow to send the annotations without even modifying the playbooks, because it is code that is always executed by Ansible, no matter what you do in the playbooks.
But the code is executed only at specific stages of the playbook run.
Since our objective was to have all deployments (whatever the playbook) being visible in the Grafana dashboards, a callback seemed to be the good option as everything becomes traceable as soon as the callback is enabled.
We also have all our playbooks idempotent and we did not want to lose that or spend too much time trying to keep it while adding the grafana annotations through a module use.
I won’t explain how the Ansible callback works, or how we implemented it, but the code is available on Github (and was submitted to the Ansible repository and is awaiting review while I’m writing these lines).
Choose the proper representation
You may have noticed that we have 2 kinds of annotations available in Grafana:
The regular annotation
A simple bar with information available on hover. The annotation has only one time indication.
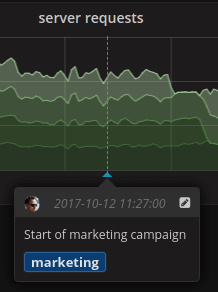
In our use case it fits the notification of playbook start or failure.
The region annotation
Aims at representing a period on the Graph. The annotation has two time indication, one for the event start time, the second for the event end time.
The event information are available on hover anywhere between the start/stop times.
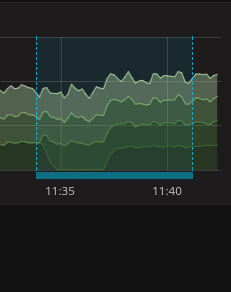
In our use case it fits the representation of the playbook execution period (and duration).
Install/Enable the callback
From the Ansible documentation:
You can activate a custom callback by either dropping it into a callback_plugins directory adjacent to your play, inside a role, or by putting it in one of the callback directory sources configured in ansible.cfg.
Plugins are loaded in alphanumeric order. For example, a plugin implemented in a file named 1_first.py would run before a plugin file named 2_second.py.
Most callbacks shipped with Ansible are disabled by default and need to be whitelisted in your ansible.cfg file in order to function. For example:
#callback_whitelist = timer, mail, profile_roles
In our case, the Grafana callback is not shipped with Ansible, so we will have to create the “callback_plugins” directory near our playbooks:
$ cd <your_playbook_dir> $ mkdir callback_plugins
Then copy the callback source into the directory:
$ cd callback_plugins $ wget https://raw.githubusercontent.com/rrey/ansible-callback-grafana-annotations/master/callback_plugins/grafana_annotations.py
Finally, enable the plugin in the ansible.cfg by adding it in the variable “callback_whitelist”:
[...] callback_whitelist = grafana_annotations
Note: You may have to create the ansible.cfg as it is not created by default when you install Ansible.
Different location are supported, see the Ansible documentation.
Once the callback is enabled, you’ll have to set some environment variables to provide the callback the required information. Here is the different parameters you can define through the environment available:
- GRAFANA_SERVER : The Grafana server address
- GRAFANA_PORT : The Grafana server listen port.
- GRAFANA_SECURE : Boolean (default 0). If set to 1, you define that HTTPS protocol should be use to talk to the API.
- GRAFANA_API_TOKEN : The Grafana API Token to be used for the authentication.
With the environment variables set, you can run your playbooks without changing anything in the Ansible command call.
Demo time!
Let’s do a quick demo!
First let’s start a Grafana instance through docker:
$ docker pull grafana/grafana $ docker run -d --name=grafana -p 3000:3000 grafana/grafana
You now have Grafana reachable on http://127.0.0.1:3000, the default credentials are admin/admin
Create a dashboard
Once logged in, create a Dashboard with a Graph panel and save it.
For this demo, we don’t need to create a datasource and have data available. When you create a Graph panel, Grafana displays a graph with random data. If you refresh the dashboard you will see that the data completely changes. Again, it is not important for the demo as we simply want to see the annotation displayed at the proper time.
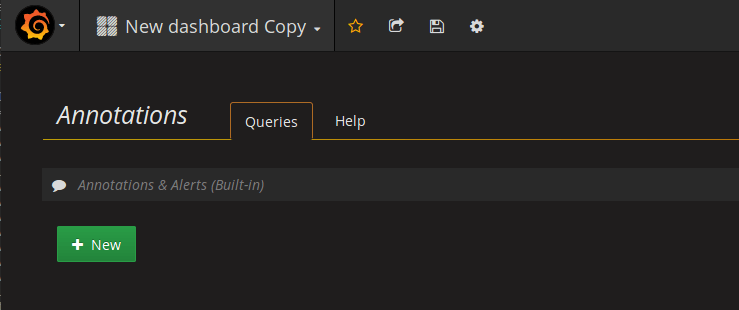
Go to the dashboard settings and go to the “annotations” sub-menu:
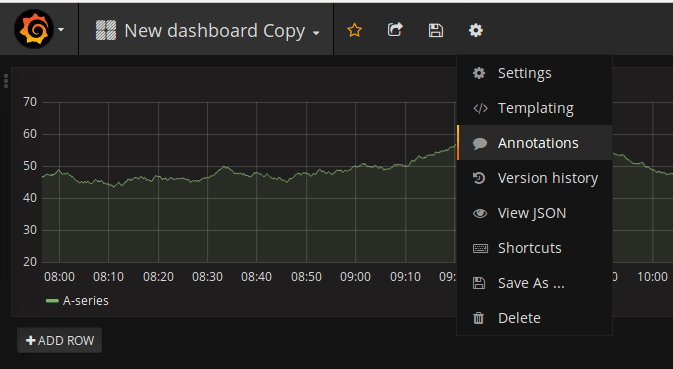
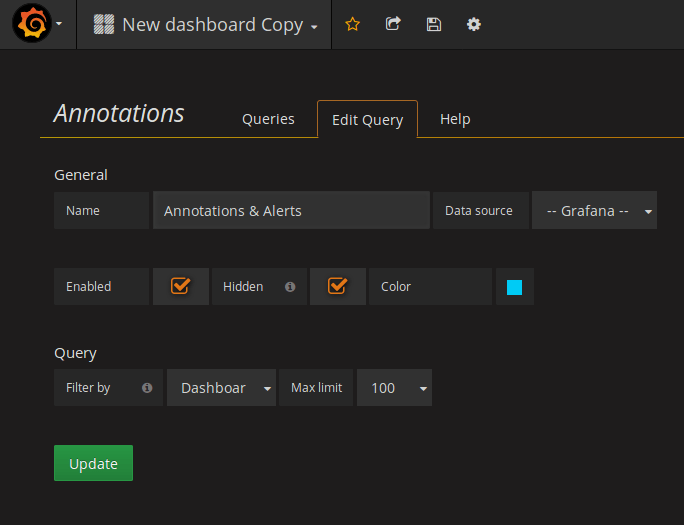
By default, a dashboard has a “built-in” annotation query that only displays the annotation and alerts of the dashboard.(You can scope an annotation to a dashboard by specifying its id).
Looking closer at this built-in query definition, we can see that the configuration specifies that the query filters by “Dashboard”.
In our case, we have an instance of Grafana and Prometheus per environment, so there is no risk of publishing annotations that are totally unrelated to the environment.
So the callback will not publish the annotations on a specific dashboard, they will be global.
Since the built-in query will only display the annotations explicitly scoped to the dashboard we need to add a new query that will be able to display our global annotations.
Click the “New” Button under the built-in query and configure the following query:
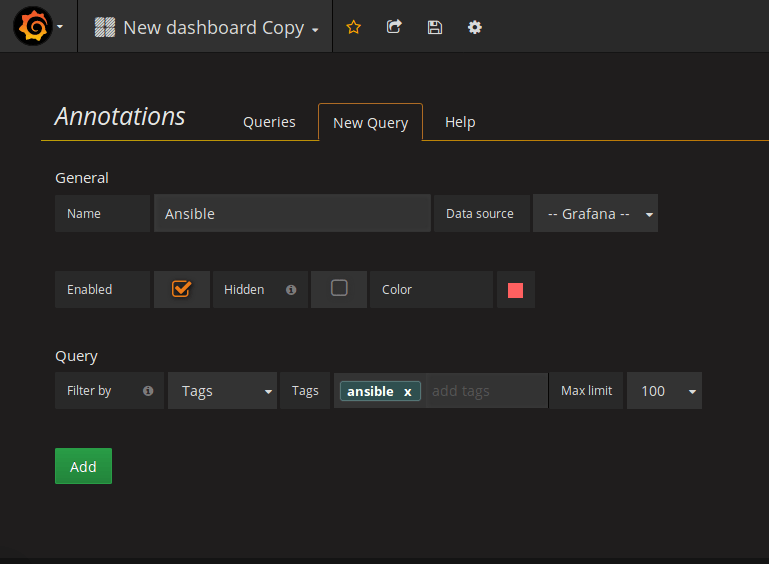
We define a query performed in Grafana’s native store, and the query filters the annotations by tags. It means that our query will look for annotations tagged with the value “ansible”, which is one of the tags defined by our callback for all annotations.
The callback also define a tag with the playbook name and 3rd tag among the following possibilities:
- ansible_event_start: set on the playbook start annotation.
- ansible_event_failure: set on the playbook failure annotation.
- ansible_report: set on the playbook stat annotation. The annotations tagged with this value will be region annotation that will cover all the playbook execution period.
For the demo, selecting the “ansible” tag will allow to display all the annotations with only one query.
Create the API Token for Ansible
If you have the dashboard and a Graph panel inside it, let’s now create an API Token for Ansible.
You can do it from Grafana UI but you can use the API like me:
$ curl -XPOST 127.0.0.1:3000/api/auth/keys --user "admin:admin" --data '{"name": "ansible-callback", "role": "Editor"}' -H "Content-Type: application/json" {"name":"ansible-callback","key":"eyJrIjoiZ2RNc2NPWXZmNE5IZmxjb1hHOGJTNk5YSjJqWXdmbVYiLCJuIjoiYW5zaWJsZS1jYWxsYmFjayIsImlkIjoxfQ=="}
The token value is returned in the server’s response. Write it somewhere, you can not get it twice, you will have to recreate it if you loose it.
Setup the environment
The configuration parameters are provided to the callback through environment variables. Export the following variables:
$ export GRAFANA_SERVER=127.0.0.1 $ export GRAFANA_PORT=3000 $ export GRAFANA_API_TOKEN=eyJrIjoiZ2RNc2NPWXZmNE5IZmxjb1hHOGJTNk5YSjJqWXdmbVYiLCJuIjoiYW5zaWJsZS1jYWxsYmFjayIsImlkIjoxfQ==
Note: be sure to replace the token value by your own.
Since Grafana is reachable through HTTP in the container, we can leave GRAFANA_SECURE to its default value. That is why I am not exporting it.
Now let’s write a dummy playbook that will not do much:
test.yml:
- hosts: localhost connection: local tasks: - debug: msg: “Hello world”
We just want to trigger the callback, so what the playbook does is not really important here.
Let’s run it:
Now that everything is ready, let’s run the playbook:
$ ansible-playbook test.yml [WARNING]: Host file not found: /etc/ansible/hosts [WARNING]: provided hosts list is empty, only localhost is available
PLAY [localhost] *************************************************************************************************************************************************************************************
TASK [Gathering Facts] ******************************************************************************************************************************************************************************* ok: [localhost] TASK [debug] ***************************************************************************************************************************************************************************************** ok: [localhost] => { "msg": "“Hello world”" } PLAY RECAP ******************************************************************************************************************************************************************************************* localhost : ok=2 changed=0 unreachable=0 failed=0
Check your dashboard and enjoy the fancy annotations!
Annotations in details
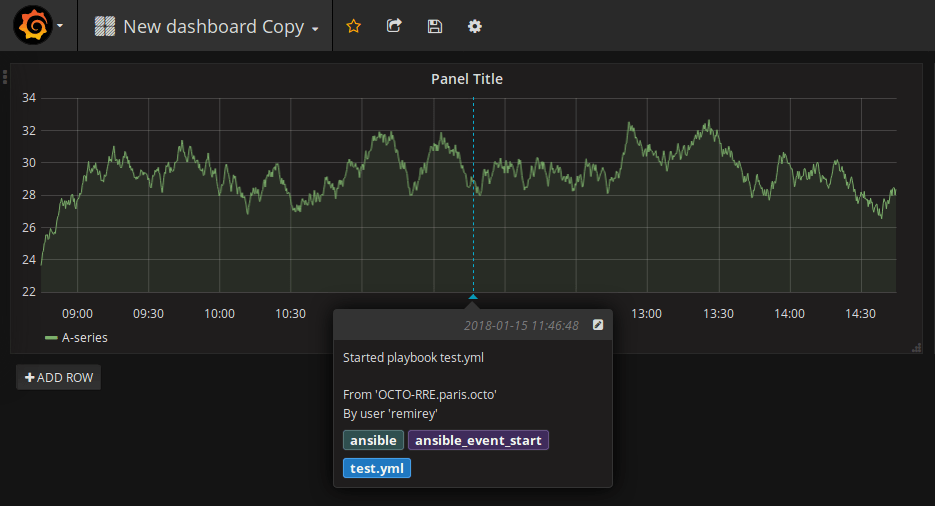
The playbook start annotation
This annotation aims at notifying of a playbook execution. Since a region annotation needs a start time and an end time, it is not possible to create the region before the end of the playbook.
We can still have something visible on the Grafana dashboard by having this simple annotation so that anyone watching the dashboard can see something is going on before it ended.
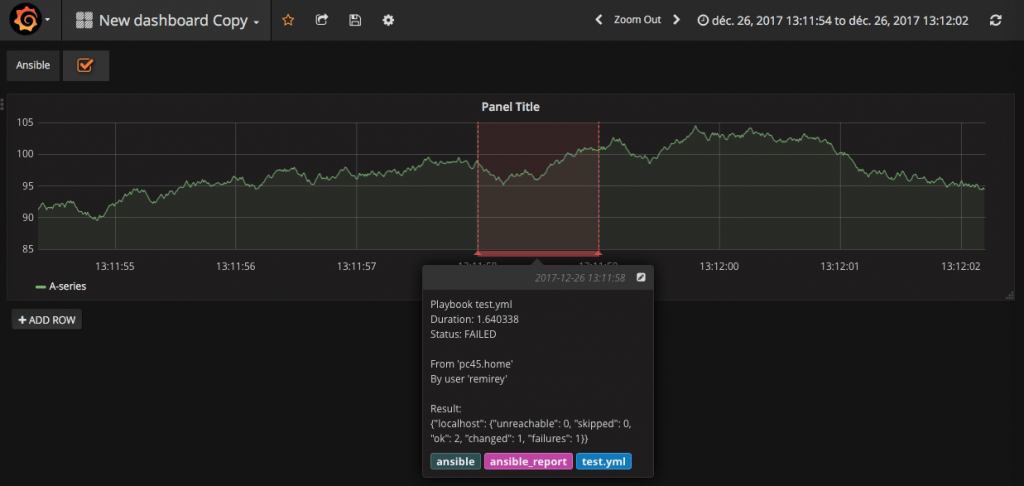
The playbook report annotation
The annotation allows to see the playbook run period through a region annotation.
Now if you see huge peaks/falls in a panel, you immediately see that it is related to a deployment, you don’t question yourself about the possible root cause of the problem to realize that a deployment was performed.
Howdy! That’s nice!
Now we just have to configure our Jenkins (or any kind of CI/CD tool) pipeline/jobs to define the environment variable before executing the playbooks, and we’ll have all the deployments being nicely displayed in the Grafana Dashboards.
That’s it. If you have questions, comments or remarks, don’t hesitate to comment!