Using Hadoop for Value At Risk calculation Part 5
In the first part of this series, I have introduced why Hadoop framework could be useful to compute the VAR and analyze intermediate values. In the second part and third part and fourth part I have given two concrete implementations of VAR calculation with Hadoop with optimizations. Another interest of using Hadoop for Value At Risk calculation is the ability to analyse the intermediate values inside Hadoop through Hive. This is the goal of this (smaller) part of this series.
Using Hive for Business Intelligence
The major goal of that implementation with Hadoop was to keep the parameters and call prices in order to analyze them. For that purpose, I used Hive, a framework on top of Hadoop. I recommend you to read that article in order to be have a full overview. In brief, Hive is a framework that translates SQL expressions into Map/Reduce jobs and executes them in Hadoop cluster. There are two main advantages that motivated me to implement this solution:
- Hadoop can process terabytes of data. It is a way to overtake some traditional BI architectures for particular use cases;
- Defining Hive tables on top of files in HDFS (Hadoop Distributed File System) involves only creating metadata. As Hadoop has created the draw parameters and call prices in HDFS they don't need to be moved for BI analysis thus leading to potential high time reduction.
Hive is still a young framework and has some limitations. Output of the Map/Reduce must be text files which thanksfully can be compressed. Consequently, the configuration needs to be changed a bit:
jobConf.setOutputFormat(org.apache.hadoop.mapred.TextOutputFormat.class);
jobConf.setBoolean("mapred.output.compress", true);
jobConf.set("mapred.output.compression.type", CompressionType.BLOCK.toString());
jobConf.setClass("mapred.output.compression.codec", GzipCodec.class, CompressionCodec.class);
After installing Hive (please refer to that article), the table can then be defined in the Hive command line by giving it the path of the output files in HDFS:
CREATE TABLE call_prices (key STRING, price DOUBLE, k DOUBLE, r DOUBLE, s0 DOUBLE, sigma DOUBLE, t INT) ROW FORMAT DELIMITED FIELDS TERMINATED BY '\t';
CREATE EXTERNAL TABLE cp like call_prices LOCATION '/user/user/output';
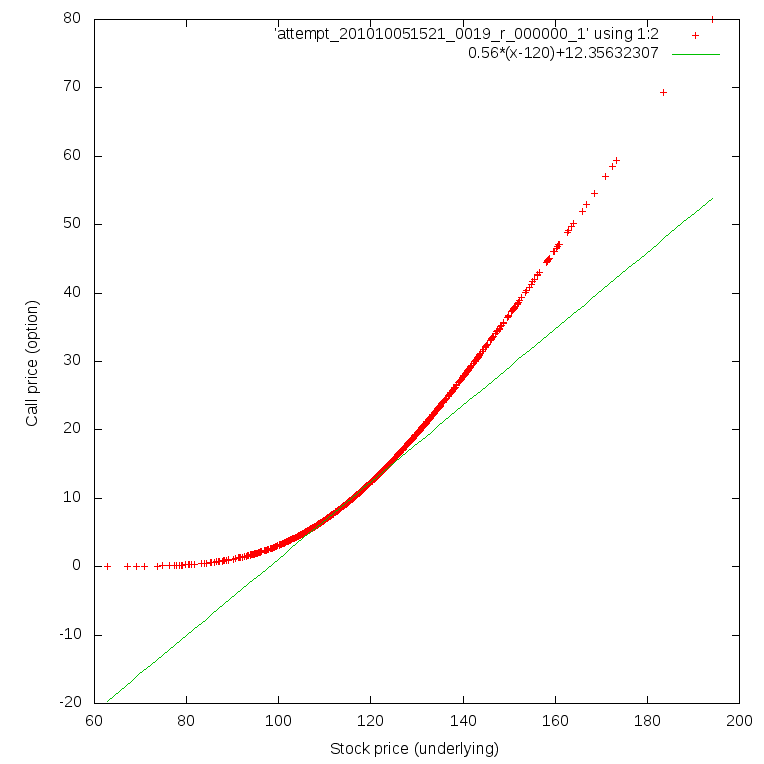
Hive only creates some metadata. I can now query my values. I give you a very simple example enabling me to show you the differences between the call price evaluated through Monte-Carlo simulation and the linear approximation toward the underlying value (it is a line whose slope equals the financial delta and goes through the point corresponding to the actual underlying and call price). By combining different Unix tools I can produce the following graph.
hive -e 'INSERT OVERWRITE LOCAL DIRECTORY "HiveOutput" select cp.s0, cp.price from cp order by cp.price;'
cat HiveOutput/attempt_201010081410_0003_r_000000_0 | tr '\001' '\t' > HiveOutput/output.txt
gnuplot -e 'set terminal png size 764,764; set output "call.png"; set xlabel "Stock price (underlying)"; set ylabel "Call price (option)"; plot "HiveOutput/output.txt" using 1:2, 0.56*(x-120)+12.35632307; exit;'
So, that concludes the detailed implementation of the VAR calculation with Hadoop framework. We have computed the VAR and are capable of analyzing the intermediate results with Hive framework on top of Hadoop. In the sixth and last part, I will give you performance figures to see how Hadoop can compete with GridGain and will conclude on the whole subject.