USI Mobile Applications: A success in figures
The 9th USI Conference organised by OCTO took place this year on June, 6th and 7th. If you do not already know what USI is, you should have a look at www.usievents.com and the great video talks on their YouTube channel (https://www.youtube.com/user/usievents).
As USI lovers, OCTO Mobility team cared to deliver the best experience to all attendees providing them good-designed, well-crafted mobile applications.
It is now time to have a deeper look into usage analytics during these two amazing days at the Carrousel du Louvre.
User analytics
All analysis are conducted on both Android and iOS platforms.
During the conference 1 303 unique users opened the applications, generating 13 299 sessions and 161 893 seen screened. It represents 85% of the 1500 attendees. Pretty huge, isn't it?
Using Google Analytics, we were able to see the number of users through the whole conference duration. This led to following chart. (Data are aggregated by hour)
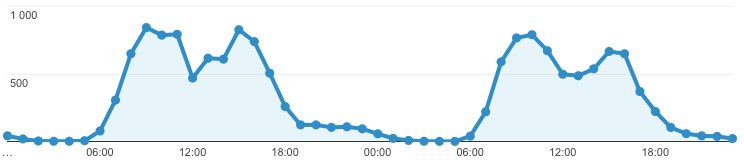
We can see that the maximum number of users was reached on the first day at 9.00 AM, when 844 attendees used the application. The 800 users line has been crossed several time during the event, showing a real user engagement. This engagement is also revealed by the average number of sessions per user: 10 sessions/user.
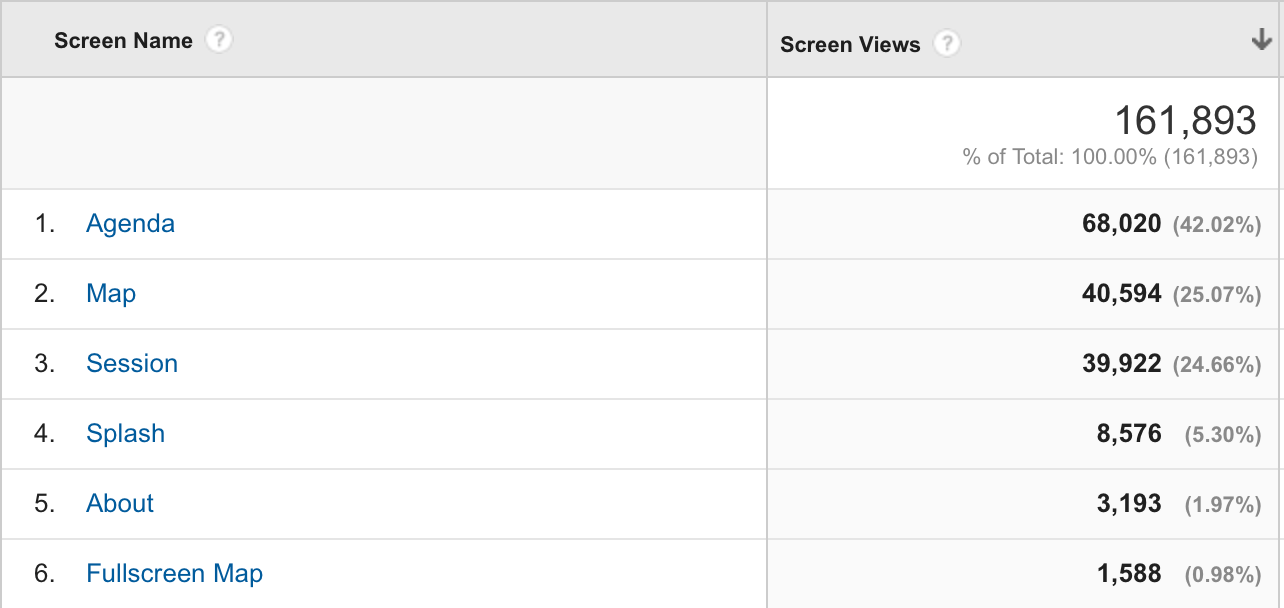
To gain a deeper understanding of how users spent there time on the apps, let's have a look at the most seen screens.
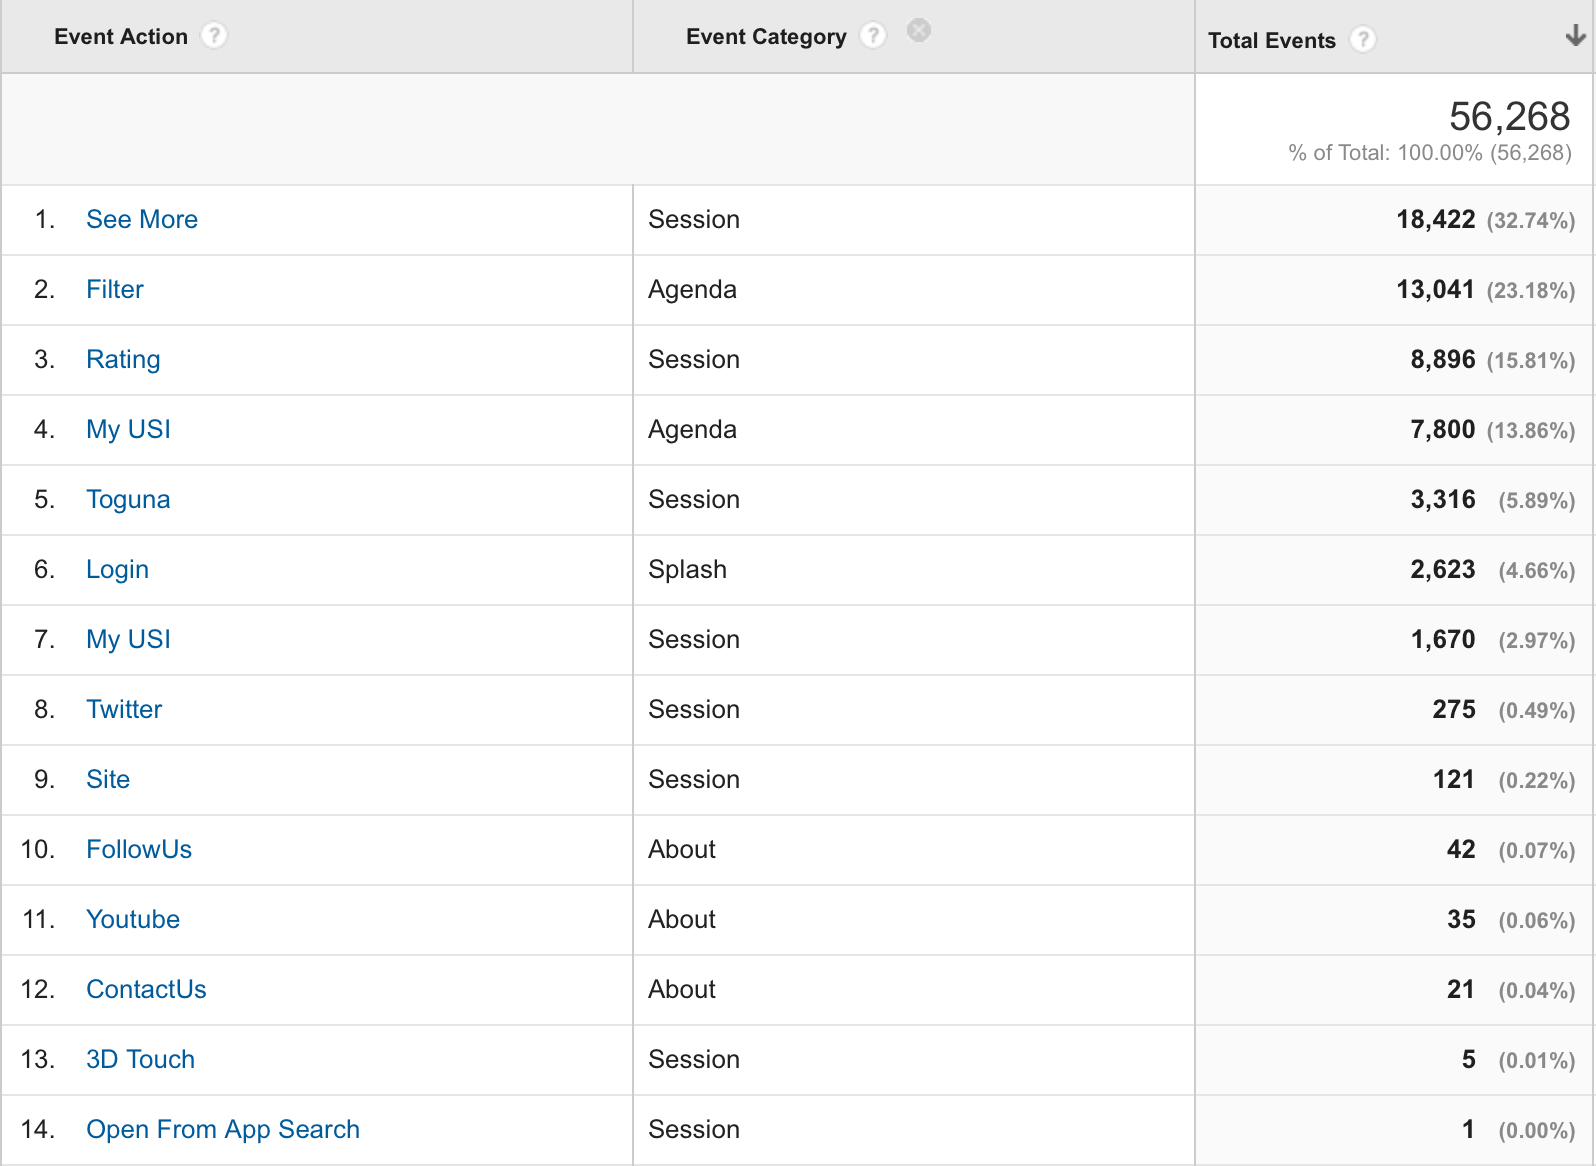
It comes as no surprise that the Agenda is the most seen screen by far, in front of Map and Session screens. The About and Fullscreen Map sections represent less than 3% of the whole navigation. As the social network subscription buttons (Twitter, mail and YouTube) were only available from the About section, these features have not been so often used, as seen on the following table.
Twitter button has only been hit 42 times, Youtube button 35 times and Mail button 21 times. The apps. did not impact the USI network visibility which comes as a disappointment to us.
Technical analytics
Integrating Fabric.io SDK in the application allowed us to track and analyse overall stability. This led to following chart for Android.
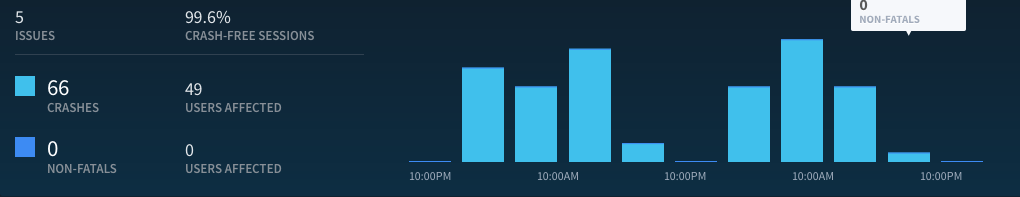
And this chart for iOS.
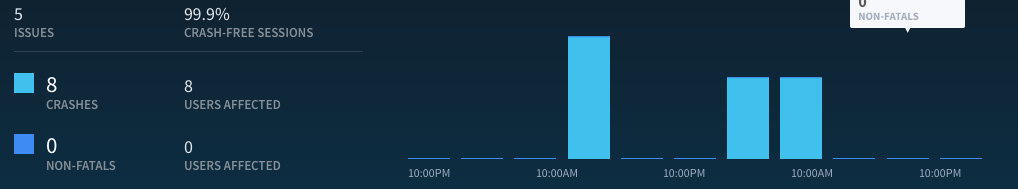
As we can see, very few users have been impacted by crashs. With only 57 users impacted by crashs, the crash-free users' rate is really high, meaning the applications stability did not impact user engagement.
Failure or success?
With a very large amount of attendees connecting about 10 times to the application during the whole event, and very few of them impacted by crash, the USI Mobile Applications were definitively a success.
With all the usage data gathered during those two days, and the real user engagement encountered, the OCTO Mobile team is motivated and committed as ever to deliver an even better User Experience for what will be a legendary 10th USI conference !