Track your Android application code quality using Sonar
When it comes to mobile applications, quality analysis is often overlooked. At first glance these short development bursts don't fit the usual canvas that comes with thorough monitoring, alerts and whatnots. What if this was just a misconception? What if the cost of setting up a proper automated quality tracking environment was actually really low? This article follows a presentation we held at soft-shake last October.
//www.slideshare.net/slideshow/embed_code/27681208
Soft shake 2013 - make use of sonar on your mobile developments from rfelden
Meet SonarQube
For the uninitiated, SonarQube is a continuous quality analysis platform running as a web server that tracks metrics regarding your code and its structure. It can be extended through plugins, and usually embeds useful tools and checks. Historically SonarQube only dealt with Java code but it has been extended since, and it handles most common languages as of today (available features may vary).
Our use case being an Android application, we are not wandering far away from the Java world. A dedicated plugin created by several Octos - sonar-android-plugin - is going to bridge the gap between pure Java code and Android code.
System prerequisites
SonarQube has to be installed on your computer to continue, a detailed procedure can be found here. For steps 2 and 3 you will need to have sonar-android-plugin installed, this is done following the standard plugin install procedure.
Project prerequisites
The usual way to analyse a project is to use either a build tool (e.g. maven) or the SonarQube Runner. Since we are working with Java, using the project build tool is common sense. Android-wise, the promoted tool would be gradle, its predecessor being ant. This is not an ideal situation, since gradle does not support all the required features yet (namely code coverage extraction) and ant, well, you know about ant (or you don't want to). To cope with all this, we are going to go the maven way. Maven has been used for quite some time on Android, unofficially but rather efficiently. I will be using Quality Tools for Android as a support. This github project provides a well-defined maven structure plus profiles covering different aspects of testing and reporting.
Demonstration
Let's use a sample application bundled with the maven-android-plugin: MorseFlash. This project is extremely trivial but suits our purpose just fine. To push things even further, here is a fork of the repository cleaned up and configured to run the full demonstration.
Let's look at the application from two points of view: one would be the regular Java code, which is very well covered by SonarQube out of the box, while the other would be Android-specific code. The latter includes layout files, resource files, everything that is not commonly found in a standard Java application. It also includes integration testing, especially its code coverage analysis.
Stage 1: look ma, no hands
Let's start with the regular aspect. Using maven, pushing analysis data into sonar is done this way: mvn sonar:sonar
Running this on our small project already gives us detailed informations regarding the code, without even using the Sonar Android plugin.
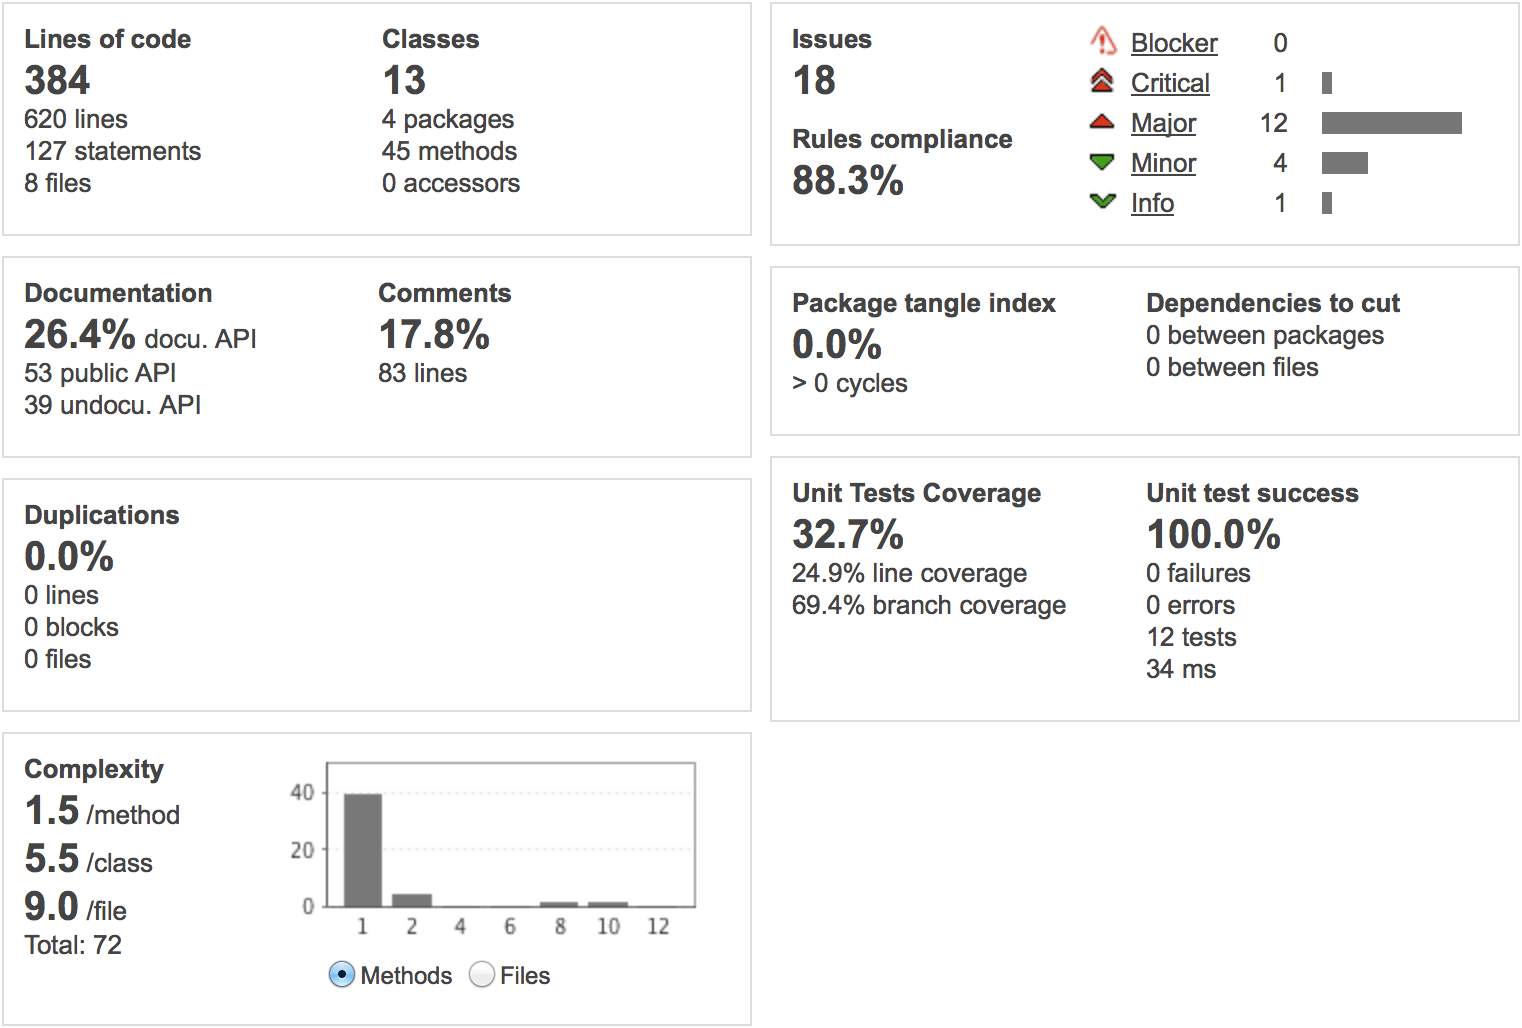
Only issues and code coverage are not accurate, since we are using a standard java reference that does not match Android specifics. You only get standard Sonar Way issues, and instrumented testing is out of the scope.
Stage 2: be specific
This is not enough, we obviously lack all the Android stuff. To help us out, let's introduce sonar-android-plugin. Added to SonarQube, it provides an Android Lint based profile and contains a whole new set of violations and issues regarding API levels, graphic performance (layout optimisations) and other fancy checks.
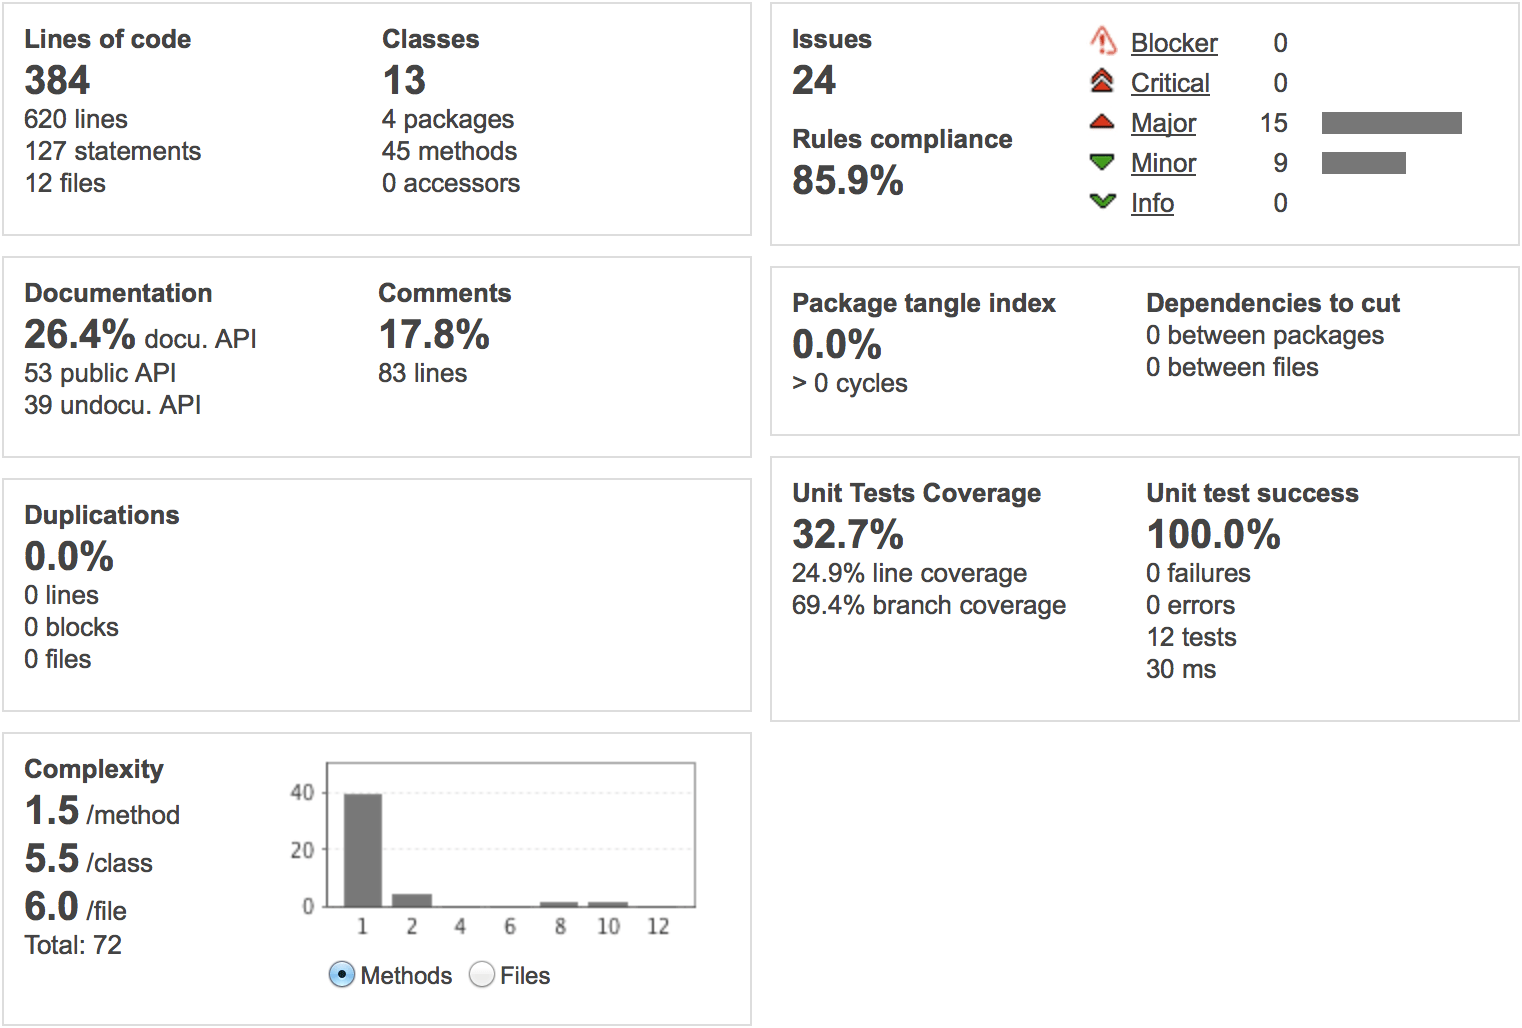
Here is what we get with the plugin added. Running mvn clean install and then mvn -Dsonar.profile="Android Lint" sonar:sonar we can see that the number of code files increased (8 to 12, counting 4 new xml files) and so did the number of issues, with a slightly different distribution (critical and info disappeared).
Tip: To use both profiles at once (and possibly keep irrelevant messages) it is possible to have Android Lint inherit from Sonar Way.
Tip: we have to run clean install before sonar:sonar because Android Lint requires the code to be compiled.
Stage 3: the full monty
There is still a missing part regarding integration testing. Code coverage is generated on the device using emma (built in the maven-android-plugin) and will be extracted using JaCoCo if we add the following settings (taken from the Quality Tools for Android, with only minor changes).
(pom.xml)
<profile> <id>sonar</id> <modules> <module>morse-lib</module> <module>morseflash-app</module> <module>morseflash-instrumentation</module> </modules>
<properties>
    <sonar.profile>Android Lint</sonar.profile>
    <sonar.jacoco.excludes>\*test\*</sonar.jacoco.excludes>
    <sonar.jacoco.itReportPath>target/jacoco-it.exec</sonar.jacoco.itReportPath>
    <sonar.jacoco.reportPath>jacoco.exec</sonar.jacoco.reportPath>
    <sonar.core.codeCoveragePlugin>jacoco</sonar.core.codeCoveragePlugin>
    <sonar.skippedModules>morseflash-instrumentation</sonar.skippedModules>
    <sonar.exclusions>\*\*/org/jacoco/\*\*</sonar.exclusions>
    <jacoco.version>0.6.2.201302030002</jacoco.version>
</properties>

<dependencyManagement>
    <dependencies>
        <dependency>
            <groupId>org.jacoco</groupId>
            <artifactId>org.jacoco.agent</artifactId>
            <version>${jacoco.version}</version>
            <classifier>runtime</classifier>
        </dependency>
    </dependencies>
</dependencyManagement>
<build>
    <pluginManagement>
        <plugins>
            <plugin>
                <groupId>org.jacoco</groupId>
                <artifactId>jacoco-maven-plugin</artifactId>
                <version>${jacoco.version}</version>
            </plugin>
        </plugins>
    </pluginManagement>
</build>
</profile>
(morseflash-app/pom.xml)
<profile> <id>sonar</id> <dependencies> <dependency> <groupId>org.jacoco</groupId> <artifactId>org.jacoco.agent</artifactId> <classifier>runtime</classifier> <scope>compile</scope> </dependency> </dependencies> <build> <plugins> <plugin> <groupId>org.jacoco</groupId> <artifactId>jacoco-maven-plugin</artifactId> <executions> <execution> <id>instrument-classes</id> <goals> <goal>instrument</goal> </goals> <configuration> <excludes> <exclude>*test*</exclude> <exclude>*/test/*</exclude> </excludes> </configuration> </execution> <execution> <id>restore-instrumented-classes</id> <phase>package</phase> <goals> <goal>restore-instrumented-classes</goal> </goals> </execution> </executions> </plugin> <plugin> <groupId>com.jayway.maven.plugins.android.generation2</groupId> <artifactId>android-maven-plugin</artifactId> <configuration> <test> <coverage>true</coverage> <createReport>true</createReport> </test> </configuration> <extensions>true</extensions> </plugin> </plugins> </build> </profile>
(morseflash-instrumentation/pom.xml)
<profiles> <profile> <id>sonar</id> <build> <plugins> <plugin> <groupId>com.jayway.maven.plugins.android.generation2</groupId> <artifactId>android-maven-plugin</artifactId> <configuration> <dex> <!-- Required for EMMA --> <noLocals>true</noLocals> </dex> <test> <coverage>true</coverage> <createReport>true</createReport> </test> </configuration> <executions> <execution> <id>pull-coverage</id> <phase>post-integration-test</phase> <goals> <goal>pull</goal> </goals> <configuration> <pullSource>/data/data/com.simpligility.android.morseflash/files/coverage.ec</pullSource> <pullDestination>${project.basedir}/../morseflash-app/target/jacoco-it.exec</pullDestination> </configuration> </execution> </executions> </plugin> </plugins> </build> </profile> </profiles>
Tip: to extract the code coverage file, the device must be connected with adb in root mode. If you are using GenyMotion don't forget to list the attached devices first so you know the IP address, because switching adb to root mode disconnects the device and it does not reattach automatically. Here is the complete procedure: adb devices adb root adb connect <ip-address>
The data we obtain is indeed more accurate, as you can see on the following screenshot.
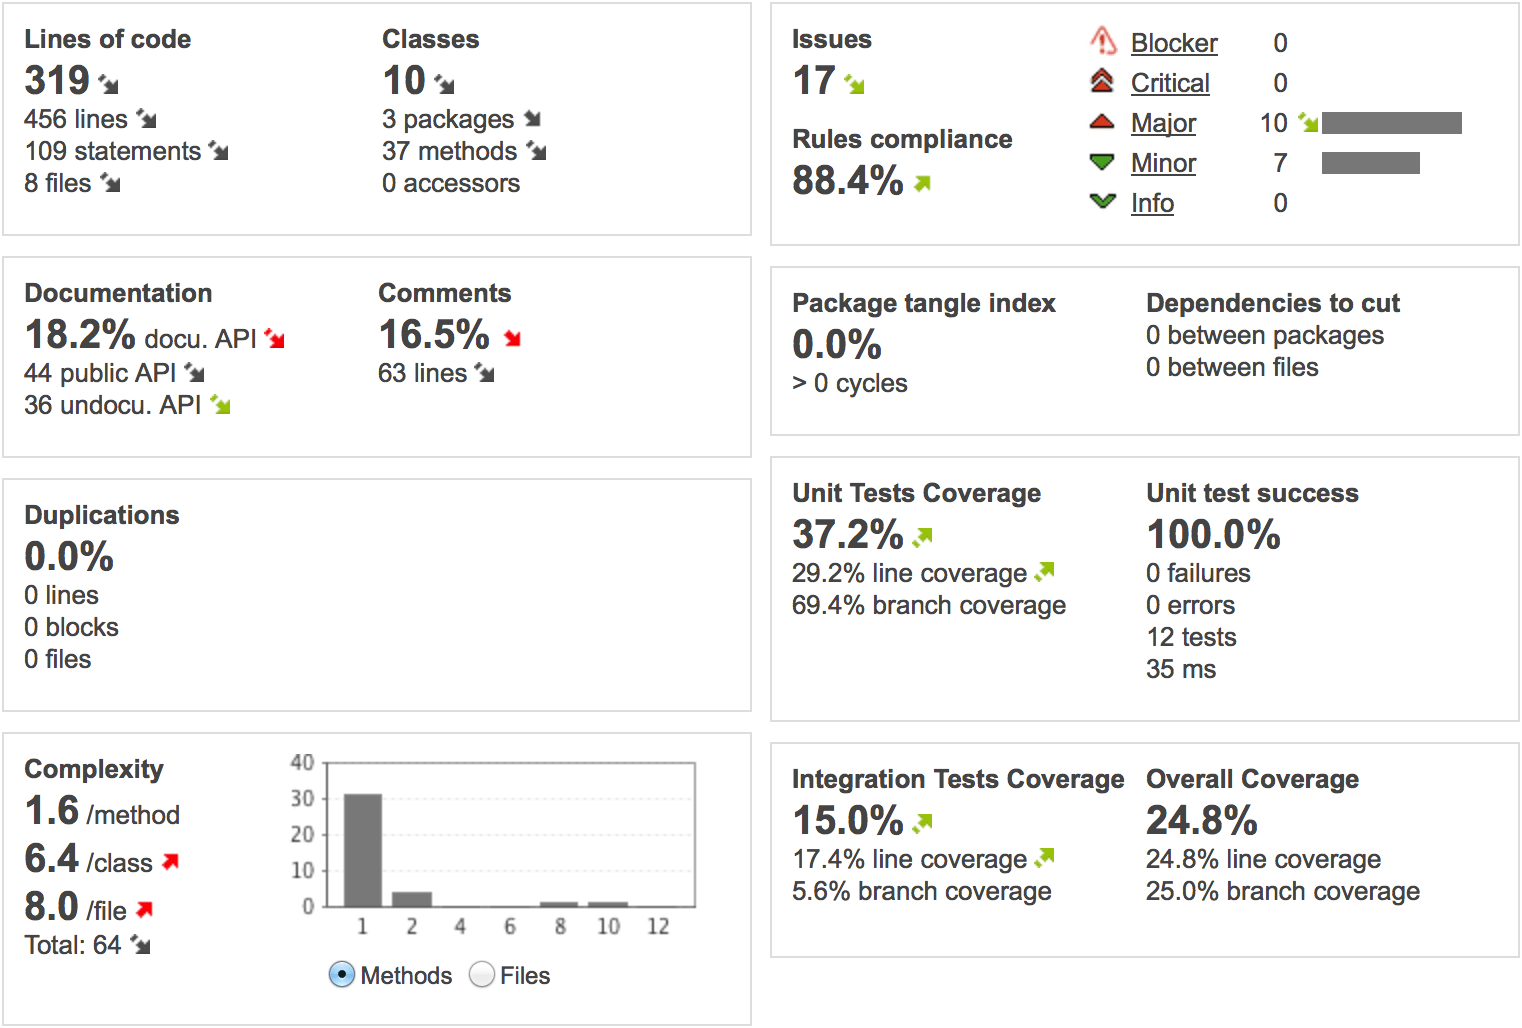
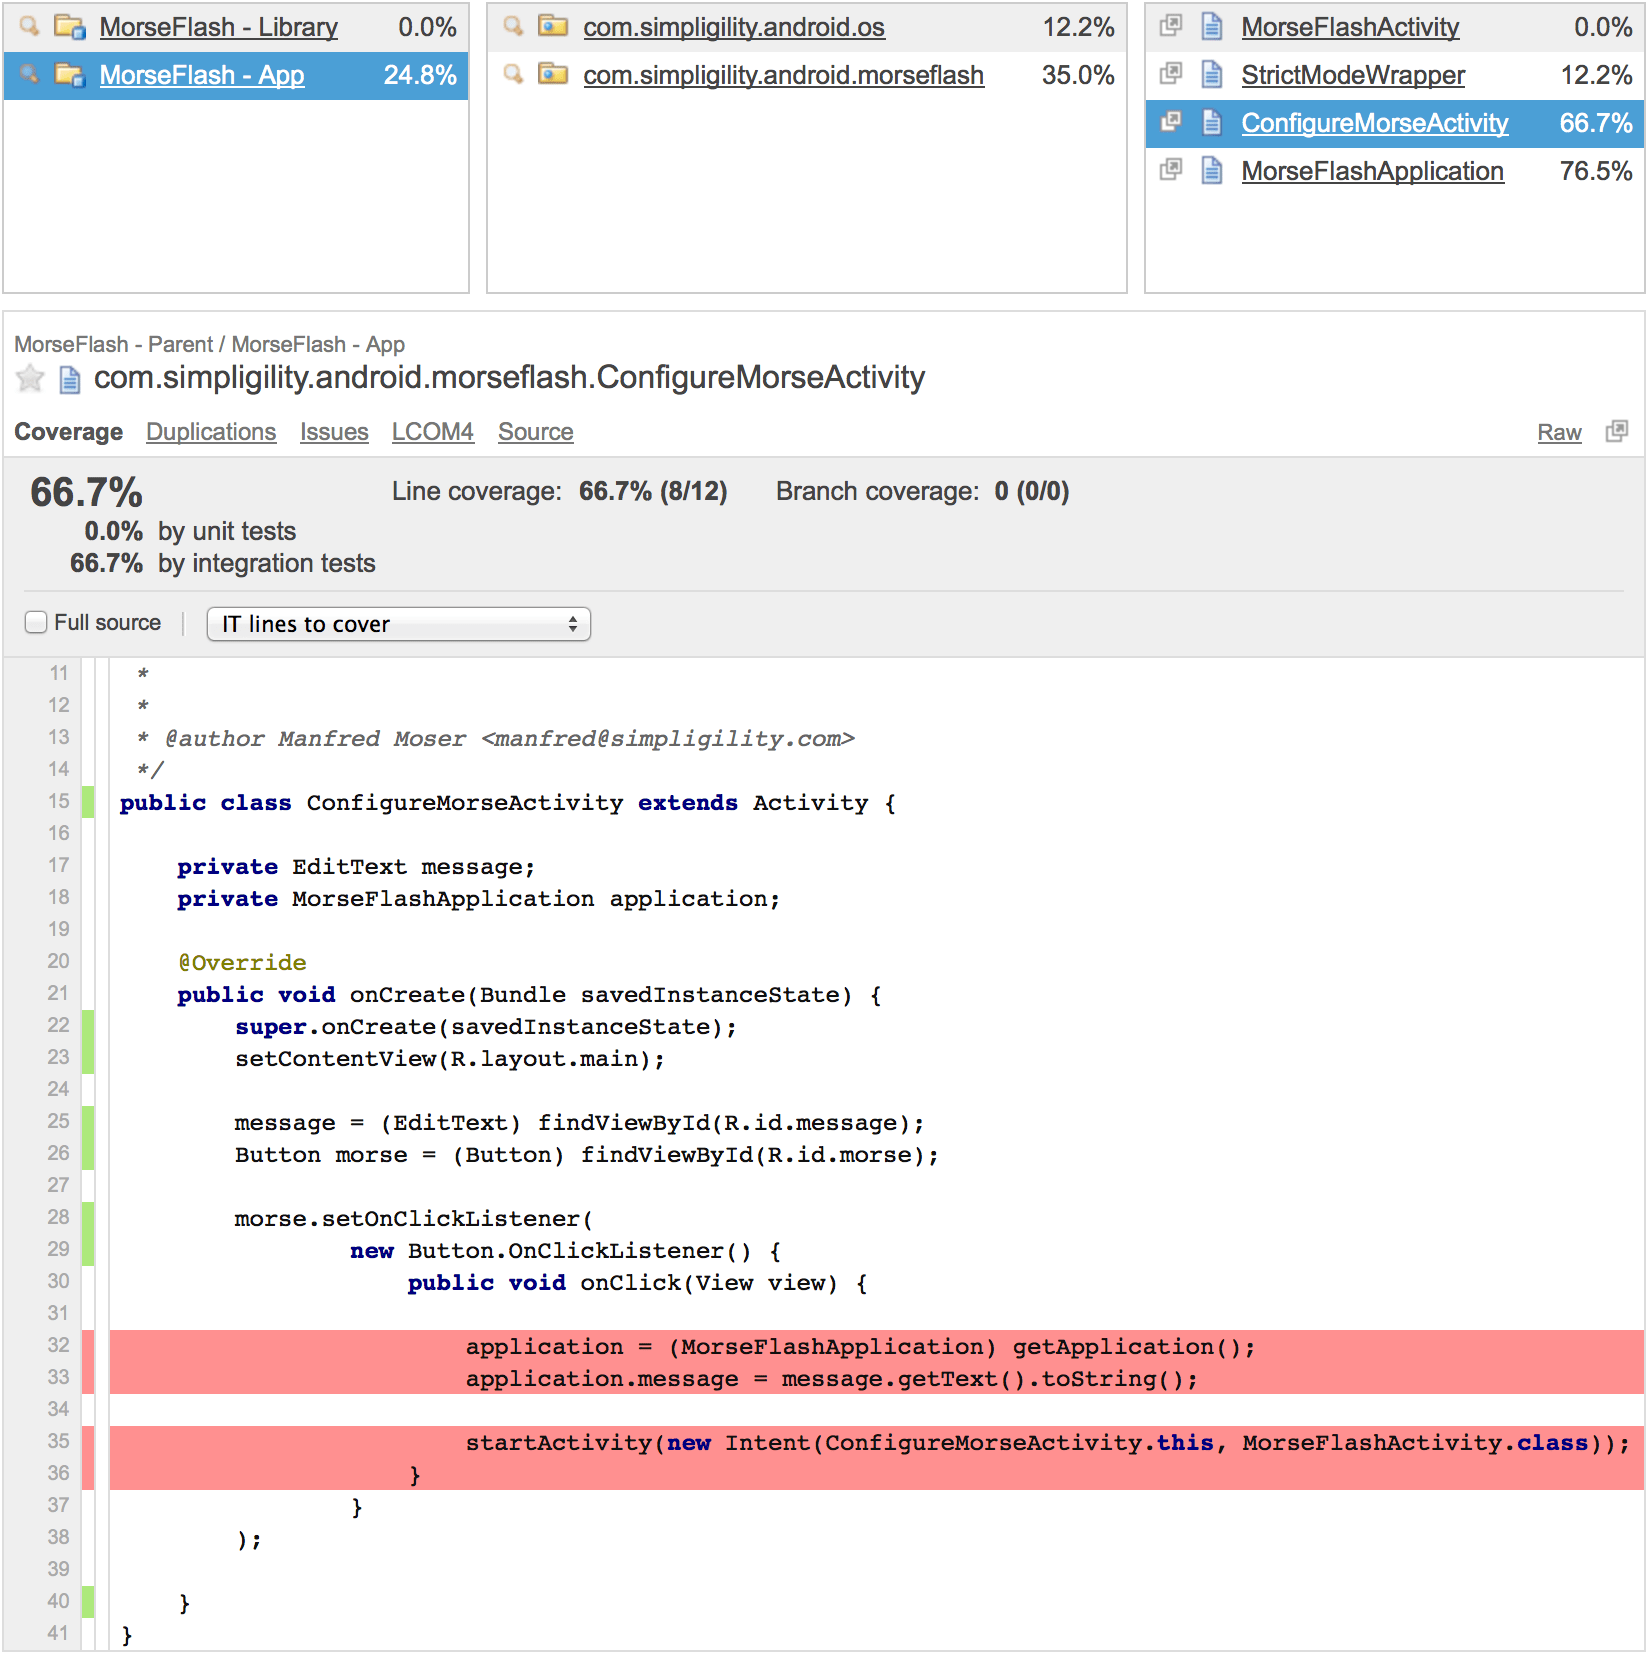
There is a flaw in the code coverage counting though, but it is actually due to the tests in morseflash-app that only target code in morse-lib (duplicate class MorseCodeConverterTest that can be found in both modules). In the end you obtain figures that you can drill down into, giving you a fine grain view on covered code.
Why did I tell you all this?
These steps only aim at providing a detailed view of what is needed to obtain relevant metrics on an Android project. One could have boldly skipped to the last step, getting the whole shebang at once and possibly defeating the purpose of this demonstration.
Either way, now you know how to get relevant metrics out of your neat Android application in no time using Sonar.