Drift detector toolkit: how to choose the right detection method
This article gives some best practices for understanding and choosing which drift detector method to use in your project.
In a nutshell
Not all drift detectors are equal: the right choice depends on your data type, the availability of labels, and whether you want to detect univariate or multivariate drift. This guide walks you through the main detector families and helps you pick the right one for your scenario.
Introduction
Previously in Part 1 and 2
This is Part 3 of the Drift Article series.
Part 1 gave an introduction to concept drifts: how to define a drift, what are the different types of drift and what can you do to detect them. To find out more, the link to the article is here.
In Part 2, we practiced how to induce and detect drifts using this GitHub package. We dived deeper into the drift detector families and their respective performance on various types of drifts. The link to the article is here.
Now, a question remains: how to choose the drift detector best suited for your situation? This is the aim of this article.
The different drift detector families
The below table is a brief summary of the detector families that we will compare throughout this article.
| Family Name | Description | Example | Tool used |
|---|---|---|---|
| Univariate Drift Detectors | Detects drifts by going through each feature and comparing the new batch distribution with the training distribution | 2-sample Kolmogorov-Smirnov Test Wasserstein Distance Population Stability Index (PSI) | Evidently AI DeepChecks Tensorflow Data Validation |
| Multivariate Drift Detectors | Detects drifts by looking at the covariates (not feature by feature) and comparing them with the training distribution | Margin Density Drift Detector Method (MD3) OLINDDA Hellinger Distance Based Drift Detection Method (HDDDM) | Github and literature articles |
| Drift Detectors with Labels | Detects drifts using labels by looking at the model performance (called error rate) | Early Drift Detection Method (EDDM) Hoeffding Drift Detection Method (HDDM_W) ADaptive WINdowing (ADWIN) | Python package River |
How the article is constructed
Depending on your use case, you will have to compromise between a very accurate and sensitive detector with many potential false alarms or a less accurate detector where you avoid constant disturbances. You may also only be interested in drops in the model performance.
The article is split into four parts. The first part gives several scenarios and recommends the most appropriate drift detector family to use for each scenario. The next 3 parts give extended information about each drift detector family: part 2 gives guidelines about univariate drift detectors, part 3 about drift detectors with labels and part 4 about multivariate drift detectors.
If you’re only interested in one specific drift detector family, you are welcome to go directly onto the detailed section.
I. What drift detector family should I use?
Scenario 1
“I am working on very sensitive health data. My model is closely linked to people’s health so it is crucial for my team to be aware of even the smallest change in my data.”
Because you cannot afford any mistakes, you will want to have full visibility of the dataset and its potential drifts over time. And because any type of drift could impact your model, you will be interested in both real and virtual concept drifts. Yet, you are aware that this level of monitoring will come at the expense of false alarms.
Implementing univariate drift detectors will therefore ensure that you keep an overview of all features of your model.
There are many platforms available: Cloud-based, private, or open-source. A particularly useful platform is DeepChecks [20]: its Feature Drift check efficiently detects virtual concept drifts. It also includes another useful check: Whole Dataset Drift which will enable you to also detect some real concept drifts.
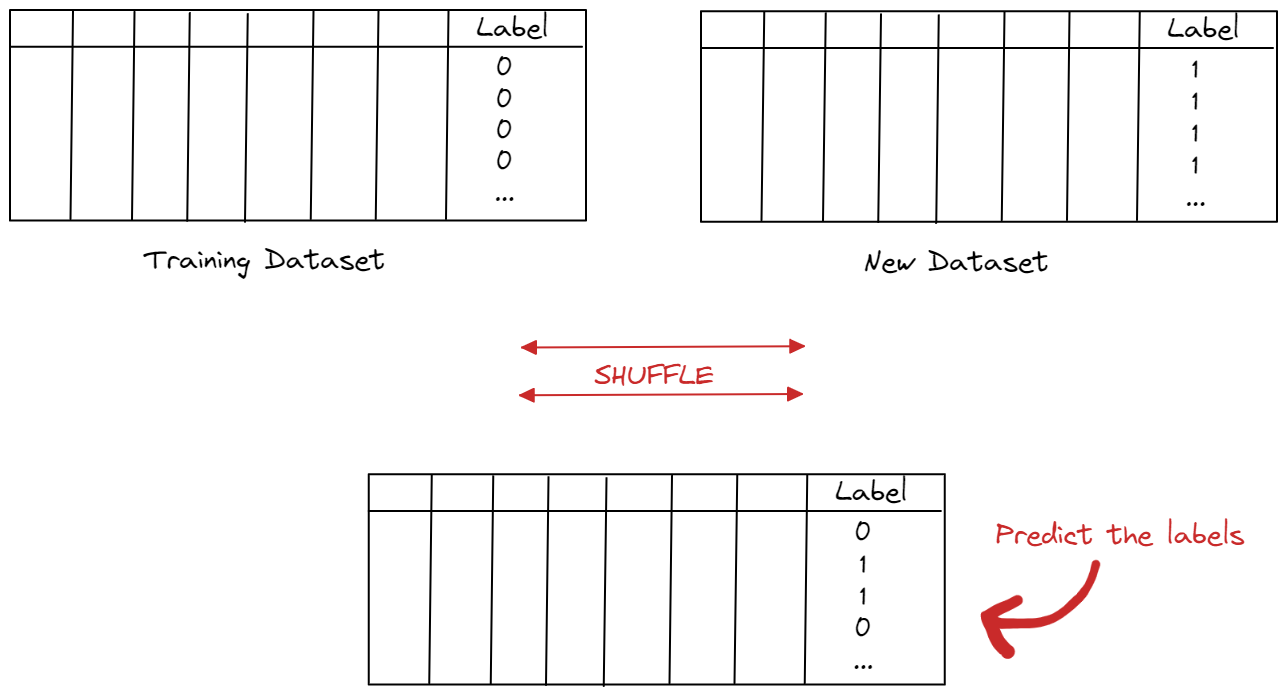
Whole Dataset Drift works the following way: we add a column label which will be 0 for the training dataset sample and 1 for the new batch sample. We then merge the two datasets together and shuffle. The goal is to predict whether a data point is 0 or 1. If we can distinguish between the old and new datasets, then it is likely that a drift occurred. If we cannot distinguish between the two datasets, no need to worry about drifts. The below plot illustrates how the Whole Dataset Drift works.
For more information, you can visit Deepchecks’ documentation. It also gives information about the drift score and how to interpret it.
Evidently AI [8] can also be a powerful tool. Although the default metrics can be very sensitive (many false alarms), the platform gives you the flexibility to choose your own.
Scenario 2
“My model is used to detect anomalies in a factory. Nothing life-threatening but the company will lose money if the model drifts too much.”
You are clearly interested in drifts that impact the model’s performance. This is exactly what the family of drift detectors with labels does: it compares the predicted and actual values and computes an error rate. However, it has a main drawback: you need immediate and fast access to those labels. If you are able to get those labels, you have found your ideal detector family: the drift detectors with labels.
However, if you are not able to access the true values, below are some alternative options:
- Use Deepcheck Whole Dataset drift. As we saw in the previous section, Deepcheck Whole Dataset drift will assess whether the new batch is similar to the old batch. An alarm will not always be associated with a drop in the model’s performance, but it is a good starting point.
- Use Deepcheck Prediction drift. It is another useful check to do. It compares the distribution of predicted values across time. If the predicted values start to be very different from the previous prediction values, it may mean that a drift happened. It’s important to note that concept drifts in predicted values may not always mean a drop in performance.
- Use the Margin Density Drift Detection method (MD3) [18]. It is a multivariate drift detection method that measures the ratio of samples close to the decision boundary. Those samples are called “uncertain samples”. If we see a rise in the proportion of uncertain samples, it could mean that a drift occurred. It has a direct impact on the model’s performance, which would be suitable for scenario 2.
One last comment about MD3: it can be easily adapted to Machine Learning models that aren’t rule-based. For aggregated models, we can use the “disagreement” between individual models to determine an “uncertain sample”.
Scenario 3
“I am monitoring many models in production. I really don’t want constant alarms so I am really interested in knowing only when a big change happens in my data.”
You want a detection method that effectively detects large drifts but you don’t want alarms. We will first clarify what is meant by large drifts and then suggest detector methods.
Drift in performance
By large drift, you may mean a drift that impacts the model’s performance. In that case, go to Scenario 2.
Geographical drifts
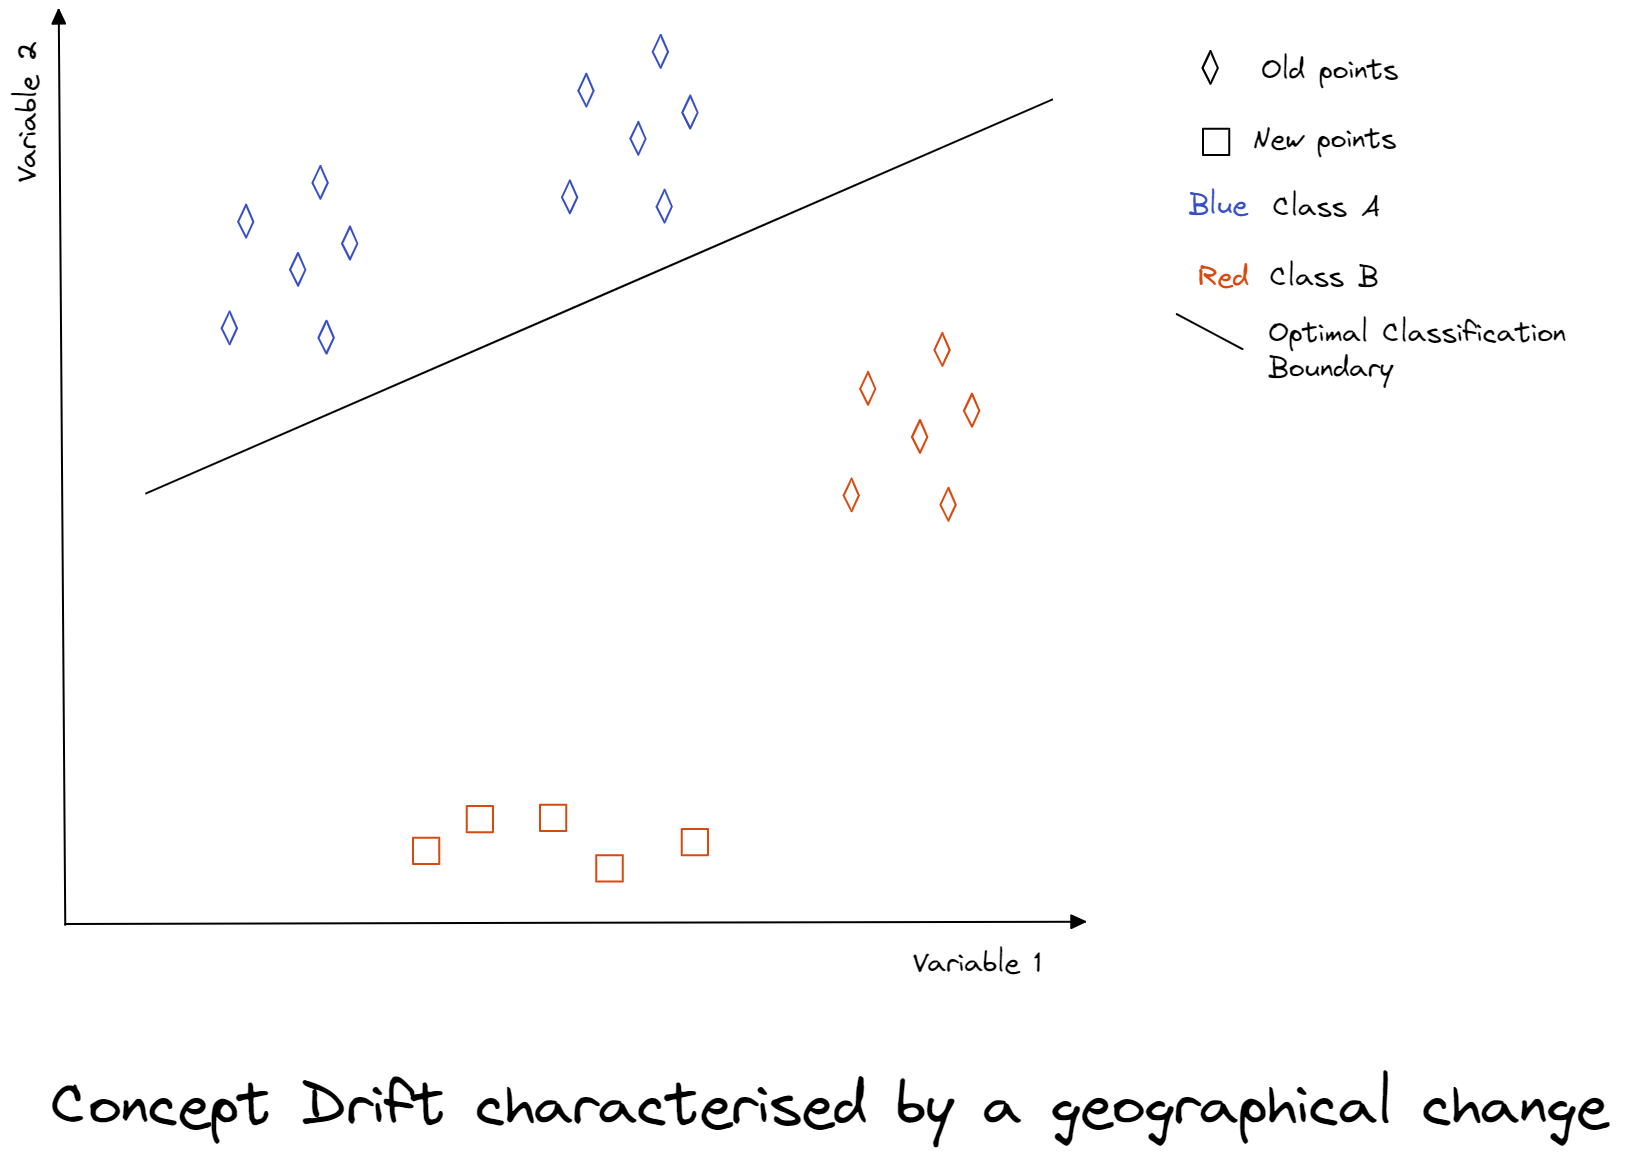
Large drift may also mean a geographical shift in the dataset. Although they may be associated with a change in the model’s performance, it may not be the case.
In the below graph, we use two variables to classify points as Class A or B. We can see that the new points are geographically different from the old points but the model performance has not changed: their classification is right.
In that case, drift detection methods focusing on the model’s performance would not detect this drift, whereas detectors looking at the geographical changes would detect the drift.
- OLINDDA [19] is a multivariate drift detection technique that uses K-means to detect whether some data points of the new batch will form a new cluster. OLINDDA can therefore detect geographical shifts which can be translated as concept drift or novelties.
- Hellinger Distance Drift Detection Method (HDDDM) [4] can also efficiently detect concept drifts. One key advantage of this method is that it is adaptive and incremental: the threshold will be adapted when drifts are detected. One drawback of this technique is that it is sometimes not sensitive enough: out of the many experiments done as part of our research, HDDDM was the least sensitive method.
II. Choosing an univariate drift detector method
You decided to go with the univariate drift detector family. Now a question remains: Wasserstein Distance, Population Stability Index, Jensen-Shannon Divergence… which one to choose?
We have put together some key guidelines in order to help you find the univariate detector best suited to your situation.
1- Feature Type
Some detectors will only work for specific data types. Therefore, we can distinguish between detectors suited for categorical features or numerical features. Other detectors will also be working for both data types.
| Suited for Categorical [9] | Suited for Numerical [9] |
|---|---|
| Kullback-Leibler divergence Jensen-Shannon Divergence Population stability index Chi-square (goodness of fit) Cramer’s V | Kullback-Leibler divergence Jensen-Shannon Divergence Population stability index Wasserstein Distance Kolmogorov-Smirnov Test |
2- Sample Size
Some drift detectors will be sensitive to the sample size. Some will not work well on small datasets, others will struggle with large datasets.
Roughly speaking, we can distinguish between statistical tests and scores. Statistical tests will be more efficient with small datasets (less than 10,000) whereas detectors using scores will be preferred for large datasets. [22]
There is an underlying statistical explanation: associated with large samples, even the smallest change can become statistically significant. Therefore, it is preferred to use scores instead of statistical tests for datasets with large sample sizes. [10]
It is also illustrated in an article written by the Drift Detector method: Evidently AI. [22] They compare five different metrics and conclude that score-based metrics are more efficient for datasets with large sample sizes.
Why don’t we just use score-based metrics then? Statistical test detectors have several advantages which we will see in the next two paragraphs.
| Suited for small sample sizes | Suited for large sample sizes |
|---|---|
| Kolmogorov-Smirnov Test Chi-square (goodness of fit) Cramer’s V | Kullback-Leibler divergence Jensen-Shannon Divergence Population Stability Index (PSI) Wasserstein Distance |
3- Detector Sensitivity
Choosing the right detector will also depend on the size of the drift you want to detect.
Evidently AI did an experiment where the dataset was shifted by respectively 1%, 5%, 7%, 10%, and 20% and compared the results between 5 different univariate detectors. [22]
Population Stability Index and Kullback-Leibler Divergence only detected large changes: they have low sensitivity.
In contrast, Kolmogorov-Smirnov Test detected the smallest changes.
Jensen-Shannon Divergence and Wasserstein distance were in between: they showed “medium” sensitivity.
It is also important to be aware that those results use the default parameters of the metric. For instance, a drift is detected if the PSI value is higher than 0.2. However, it is always possible to tune those parameters using historical data or by comparing different parameter values.
4- Interpretation
Lastly, each detector will have a different interpretation.
Statistical tests are usually easily interpreted: your null hypothesis is that both datasets come from the same distribution. Based on a p-value, you either accept or reject your null hypothesis.
For scores, it is more tricky because they usually return a value from 0 to infinity. 0 means that the distributions are identical. The higher the score, the more different from each other are the two distributions. Some score-based detectors such as Population Stability Index have set threshold values that ease the interpretation [22]:
- PSI < 0.1: no significant change
- 0.1 ≤ PSI < 0.2: moderate change
- PSI ≥ 0.2: significant change
However, other detectors are difficult to interpret. Wasserstein Distance calculates the amount of work it takes to turn one distribution into another. However, unless normed, the distances cannot be compared between each other. For instance, if one feature is in kilometers and the other one is in degrees, you will need to interpret those distances separately.
III. Choosing a drift detector with labels
You have access to labels and you decide to go with the drift detectors with labels. Which one should you choose?
First of all, there are a wide variety of drift detectors with labels. Unless you have time to dive deep into literature articles and implement manually some detectors, we would recommend using one of the eight detectors provided in the python package River [20].
1 - A winner-takes-all solution: HDDM
Several literature articles have done large-scale comparisons of concept drift detectors. The 2018 article from Barros called “A Large-scale Comparison of Concept Drift Detectors” [1] is particularly useful as it compares 14 detectors across several datasets and types of drifts.
The below graph depicts the aggregated results for those 14 detectors and shows that HDDM [16] was the most performant in terms of the Matthews Correlation Coefficient (MCC) metric.
The MCC criterion is based on the four values of the confusion matrix: True Positive (TP), True Negative (TN), False Positive (FP), and False Negative (NF).
Moreover, you can see in yellow the algorithms implemented in the package River: both HDDM-A and HDDM-W are implemented.
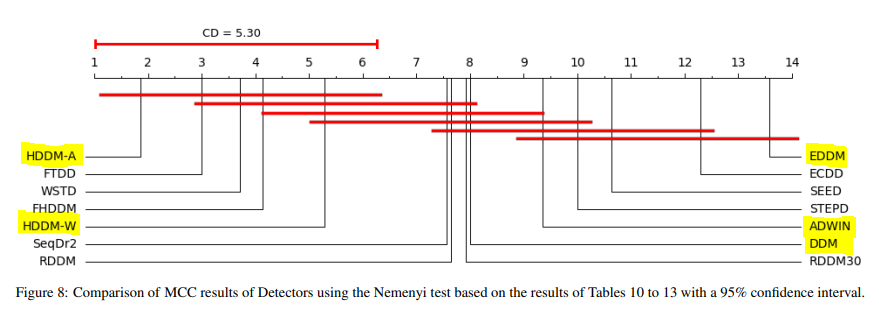
Graph extracted from “A Large-scale Comparison of Concept Drift Detectors” from Barros (2018).
Therefore, our winner-takes-all solution would be to use HDDM (HDDM_A or HDDM_W, both parameters work well) with high performance in terms of Precision, Recall, and Accuracy (what the MCC criterion measures) [16].
2- Alternatives to HDDM
If you prefer a more custom method, you can check those other guidelines:
- Gradual versus Abrupt: some detectors such as FTDD [1] (not part of the River package) perform better on abrupt datasets whereas others like RDDM [1] (not part of the River package) will detect better gradual drifts. HDDM [16] performed very well in both settings.
- Your meaning of success: perhaps the MCC criterion is not appropriate for your situation, and you would rather find the best performing model based on Recall or Precision only. For instance, HDDM_W would be recommended for Recall whereas HDDM_A is preferred for Precision.
- Size of the Dataset: some detectors will have their performance modified with the size of the dataset. For instance, it is not recommended to use HDDM_W when the dataset size is very large. In contrast, detectors such as FTDD improve as the dataset size gets larger.
- Interpretation: if interpretation is important to you, opt for a simple-to-understand detector such as EDDM [13] or DDM [16].
- Option of sliding windows: some detectors such as ADWIN [2] work with sliding windows: the window size shrinks when a drift is detected and increases otherwise.
IV. Choosing a multivariate drift detector
Multivariate Drift Detectors are a very recent subject in research and are little known in the industry. However, they can be very powerful methods.
In research, multivariate drift detectors can be classified in different ways: by data type or model type. Both classification methods are independent.
Below are some guidelines to help you find what works best for your use case.
1- Batch versus stream data
A 2020 article from Gemaque et al. “An overview of unsupervised drift detection methods” [5] introduces a taxonomy to classify multivariate drift detectors. Firstly, the authors distinguish between batch and stream data. In the batch part, they classify further how data is manipulated in the reference window. In the stream part, the criterion is how data is manipulated in the detection window (is the size fixed or dynamic).
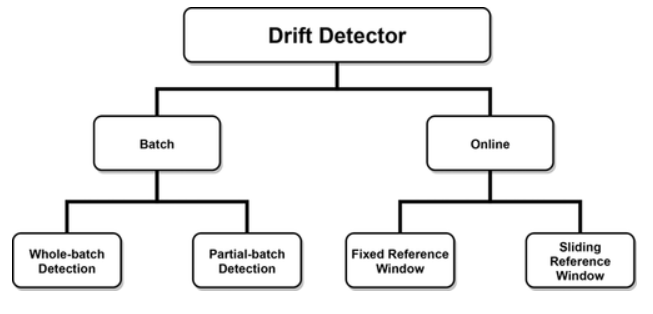
Taxonomy extracted from “An overview of unsupervised drift detection methods” from Gemaque et al. (2017).
Therefore, in order to choose your optimal multivariate drift detector, it is recommended to check your data type and how you will process it. The below table is an extract of the article and gives one detector for each section:
| Category | Subcategory | Method | References |
|---|---|---|---|
| Batch | Whole-batch detection | MD3 | Sethi and Kantardzic (2015) |
| Partial-batch detection | DDAL | Costa, Albuquerque, and Santos (2018) | |
| Online | Fixed reference window | CD-TDS | Koh (2016) |
| Sliding reference window | SAND | Haque, Khan, and Baron (2016) |
2- The Time you will spend on it
Multivariate Drift Detectors are still at a very early stage in the industry. Therefore, you will probably need to invest some time to research and implement detectors.
If you don’t have time, we would recommend using existing implemented algorithms on GitHub. The Menelaus repository [15] has implemented several algorithms that can be easily reused.
3- Your preferred methodology
In point 1, we talked about how one multivariate methodology may be more suited based on the data type. Now, we will cover the different categories of multivariate detectors so that you can select one based on your Machine Learning model. For instance, if you used a clustering model in your project such as K-means, you may want to also use a cluster-based detector.
We are relying on the taxonomy used in the 2017 article “On the Reliable Detection of Concept Drift from Streaming Unlabeled Data” by Sethi and Kantardzic [18]. Multivariate drift detectors can be split into several categories. Here we will quickly mention three of them: novelty detection, multivariate distribution, and model-dependent. In our research, we have implemented one detector in each category.
Novelty detection / Clustering-based methods
Those methods rely on “distance and/or density information to detect previously unseen
data distribution patterns” (Sethi and Kantardzic, 2017) [18].
One of them is OLINDDA (implemented in the GitHub package) which uses K-means clustering in order to detect new patterns in the data. Those patterns can be translated into concept drifts or novelty points, as the below plot shows:
Here, S1 cluster illustrates a concept drift whereas the S2 cluster depicts a novelty.
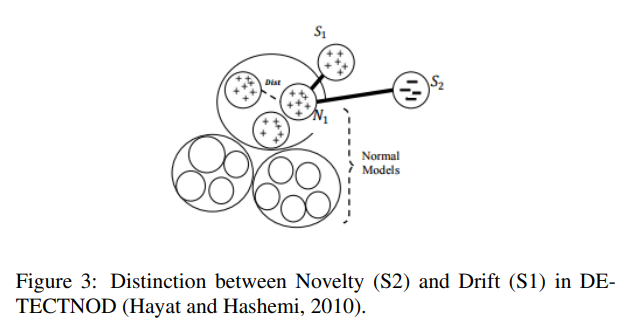
Graph extracted from the article “On the Reliable Detection of Concept Drift from Streaming Unlabeled Data” (Sethi and Kantardzic, 2017) [18] to illustrate clustering methods.
Those methods can be very powerful if the drift is manifested as a new cluster or a new region of space. However, they can suffer from the curse of dimensionality and are restricted to “cluster-able drifts” only.
Multivariate distribution monitoring methods
Those methods “store summarized information of the training data chunk [...], as the reference distribution, to monitor changes in the current data chunk” (Sethi and Kantardzic, 2017) [18].
Hellinger distance and KL-divergence are often used to monitor those changes. HDDDM belongs to this family of methods and uses the Hellinger distance to compare both batches.
The below plot illustrates how HDDDM (implemented in the GitHub package) works:
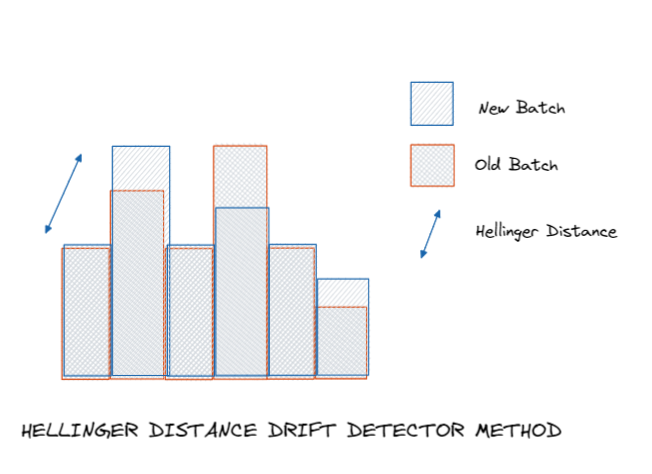
Again, those methods are powerful and limited to specific drifts: when they manifest themselves as deviations of feature distributions.
Adversarial classification methods
Inspired by adversarial classification, those methods “discern changes that could adversely affect the classification performance” (Sethi and Kantardzic, 2017) [18].
The Margin Density Drift Detection Method (MD3) monitors the change in the number of samples in the margin, as the below plot shows. MD3 is implemented in the open-source package alibi-detect [17].
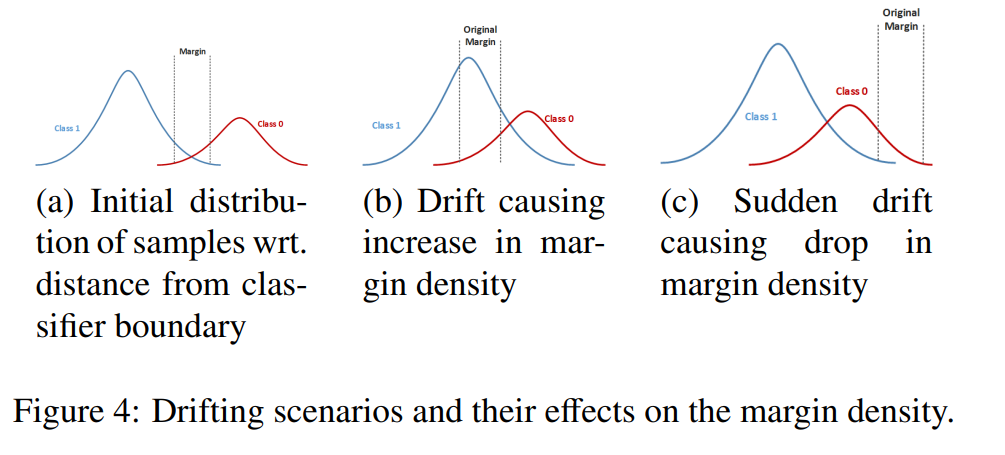
Graph extracted from the article “On the Reliable Detection of Concept Drift from Streaming Unlabeled Data” (Sethi and Kantardzic, 2017) [18] to illustrate adversarial classification methods.
Those methods have the advantage of reflecting drifts impacting the model’s performance, which leads to only a few false alarms.
Conclusion
Starting with three scenarios with various drift monitoring needs, we explored the different types of detector methods with their respective advantages and disadvantages.
Choosing a drift detector method is closely related to your project needs: the time that you have, how is your dataset, how sensitive your detector should be, etc.
There are no right or wrong choices and staying flexible will be the best way to find your optimal drift detector method.
FAQ
What is the difference between univariate and multivariate drift detection?
Univariate detectors monitor one feature at a time and are simple to set up, but may miss drift patterns that only emerge when features interact. Multivariate detectors analyse all features together, catching complex drift but requiring more computation and tuning.
Do I need labels to detect drift?
Not always. Label-based detectors (like DDM) are more accurate because they can observe actual model errors, but they require ground truth, which may arrive with a delay. Label-free detectors (like MD3 or HDDDM) can catch data distribution shifts even without labels, making them better suited for real-time production monitoring.
When should I use ADWIN?
ADWIN (Adaptive Windowing) is a good choice for univariate, concept drift detection in streaming data. It automatically adjusts its window size to detect changes in the mean of a stream, making it both sensitive and adaptive to gradual drift.
References
- Barros, Roberto Souto, and Silas Garrido Santos. “A Large-Scale Comparison of Concept Drift Detectors.” Information Sciences, vol. 451-452, 2018, pp. 348–370., https://doi.org/10.1016/j.ins.2018.04.014.
- Bifet, Albert, and Ricard Gavaldà. “Learning from Time-Changing Data with Adaptive Windowing.” Proceedings of the 2007 SIAM International Conference on Data Mining, 2007, https://doi.org/10.1137/1.9781611972771.42.
- Cabral, Danilo Rafael, and Roberto Souto Barros. “Concept Drift Detection Based on Fisher’s Exact Test.” Information Sciences, vol. 442-443, 2018, pp. 220–234., https://doi.org/10.1016/j.ins.2018.02.054.
- Ditzler, Gregory, and Robi Polikar. “Hellinger Distance Based Drift Detection for Nonstationary Environments.” 2011 IEEE Symposium on Computational Intelligence in Dynamic and Uncertain Environments (CIDUE) (2011): n. pag. Web.
- Gemaque, Rosana Noronha, et al. “An Overview of Unsupervised Drift Detection Methods.” WIREs Data Mining and Knowledge Discovery, vol. 10, no. 6, 2020, https://doi.org/10.1002/widm.1381.
- “Get Started with Tensorflow Data Validation : TFX : Tensorflow.” TensorFlow, https://www.tensorflow.org/tfx/data_validation/get_started.
- Gonçalves, Paulo M., et al. “A Comparative Study on Concept Drift Detectors.” Expert Systems with Applications, vol. 41, no. 18, 2014, pp. 8144–8156., https://doi.org/10.1016/j.eswa.2014.07.019.
- “How It Works.” What Is Evidently? – Evidently Documentation, https://docs.evidentlyai.com/.
- How to Test ML Models? (2/n): Categorical Data Drift. https://blog.giskard.ai/how-to-test-ml-models-2-n-categorical-data-drift-f99dc6335597.
- Lin, Mingfeng, et al. “Too Big to Fail: Large Samples and the Pi-Value Problem.” Information Systems Research, vol. 24, no. 4, 2013, pp. 906–917., https://doi.org/10.1287/isre.2013.0480.
- Lu, Jie, et al. “Learning under Concept Drift: A Review.” IEEE Transactions on Knowledge and Data Engineering, 2018, pp. 1–1., https://doi.org/10.1109/tkde.2018.2876857.
- “Kolmogorov–Smirnov Test.” Wikipedia, Wikimedia Foundation, 22 Apr. 2022, https://en.wikipedia.org/wiki/Kolmogorov%E2%80%93Smirnov_test.
- Manuel Baena-Garca Jose, José Del Campo- Ávila, Raúl Fidalgo, Albert Bifet, Ricard Gavaldà and Rafael Morales-bueno. “Early Drift Detection Method”, 2005, https://www.cs.upc.edu/~abifet/EDDM.pdf
- Mardziel, Piotr (Peter). “Drift Metrics: How to Select the Right Metric to Analyze Drift.” Medium, Towards Data Science, 6 Dec. 2021, https://towardsdatascience.com/drift-metrics-how-to-select-the-right-metric-to-analyze-drift-24da63e497e.
- Mitre. “Mitre/Menelaus: Implements Several Drift Detection Algorithms.” GitHub, https://github.com/mitre/menelaus.
- Pesaranghader, Ali, et al. “McDiarmid Drift Detection Methods for Evolving Data Streams.” 2018 International Joint Conference on Neural Networks (IJCNN), 2018, https://doi.org/10.1109/ijcnn.2018.8489260.
- SeldonIO. “SeldonIO/Alibi-Detect: Algorithms for Outlier, Adversarial and Drift Detection.” GitHub, https://github.com/SeldonIO/alibi-detect.
- Sethi, Tegjyot Singh, and Mehmed Kantardzic. “On the Reliable Detection of Concept Drift from Streaming Unlabeled Data.” Data Mining Lab, University of Louisville, Louisville, USA, 31 Apr. 2017, https://doi.org/https://doi.org/10.48550/arXiv.1704.00023.
- Spinosa, Eduardo J., et al. “Olindda.” Proceedings of the 2007 ACM Symposium on Applied Computing - SAC '07, 2007, https://doi.org/10.1145/1244002.1244107.
- The river. “River.” River, https://riverml.xyz/0.11.1/.
- “Welcome to Deepchecks!: Deepchecks Documentation.” Welcome to Deepchecks! – Deepchecks d6c0ce1 Documentation, https://docs.deepchecks.com/stable/index.html.
- “Which Test Is the Best? We Compared 5 Methods to Detect Data Drift on Large Datasets.” Evidently AI - Open-Source Machine Learning Monitoring, https://evidentlyai.com/blog/data-drift-detection-large-datasets.