Test your infrastructure topology on AWS
If you often come to this wonderful place, you have probably read the tale of our fellow Wizard. For those who haven’t, following this link before reading this article might help.
With Molecule we can be sure to have a fully tested component (a role in Ansible). Now, we want to be sure that each part of the entire system is working well with the others.
In this article, we will try to add another level of testing, with the following scenario: a 3 part monitoring system, composed like this:
- Prometheus Server: an open-source system and time series database used for monitoring and alerting
- Grafana: a highly customizable data visualisation tool that can display metrics
- Prometheus Node Exporter: an agent deployed on monitored servers that exposes data for Prometheus to query from
As interesting as the topic is, we will not go deep into the functionalities of these tools in this article. All you have to understand is that Grafana displays dashboards, populated by the Prometheus Server which is pulling data from the Prometheus node exporter.
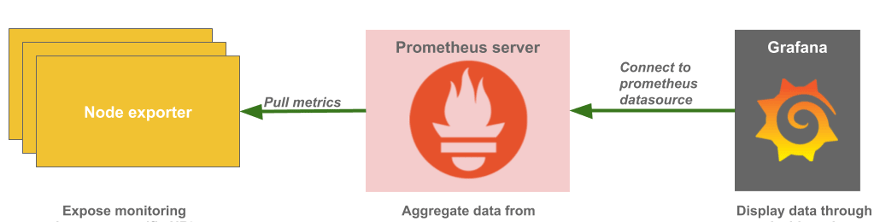
After we make sure that the 3 components are resilient, we will focus on testing the links (green line) between them.
As we want to test the configuration in real production configuration (in our case Amazon Web Services), we will also use AWS to run the tests. It is also possible to deploy the tests configuration using Docker containers. However, some settings (security or networks for example) will not be the same when we will go in production.
Prerequisites
In order to fully understand this article, you should already know how to do the following:
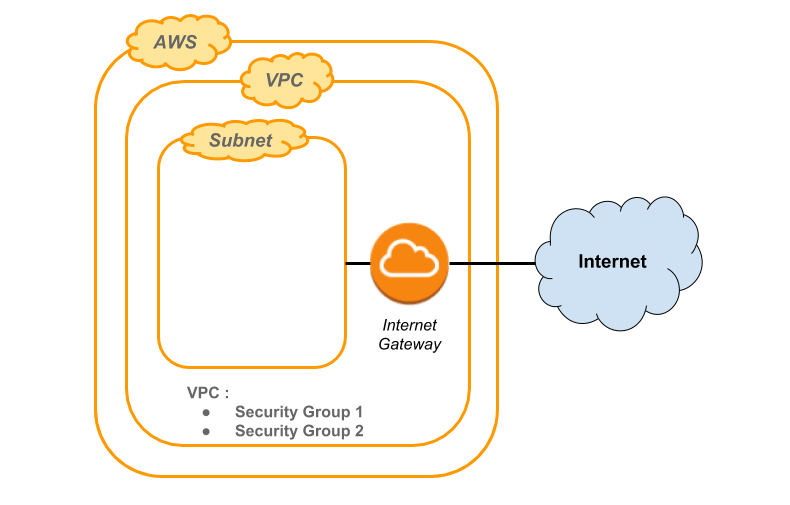
- Access AWS Management Console
- Set up your AWS credentials through ENV variables
- Create a subnet and a VPC on AWS
For this example, we have already created two specific Security Groups within a VPC, mainly to have a secured connection from our place (IP filtering) and to allow HTTP traffic between all created EC2 instances.
Setup our environment
First, we start with the configuration of our new monitoring project. As I mentioned early, we will work with AWS, meaning that every configuration we wrote are specific to use Molecule in that way.
Set your requirements.txt file to install the required libraries:
molecule==2.7.0
boto==2.48.0
boto3==1.5.23
ansible==2.4.3.0
(versions are the one used at the time of the article, so if you try this procedure afterwards, check the supported versions)
We use the boto python package which is necessary for Ansible to use Amazon Web Services.
Now we can, create a new role for the prometheus component:
$ mkdir roles
$ cd roles/
$ molecule init role --role-name prometheus --driver-name ec2
If everything went ok, we should have a directory tree structure close to the following:
├── requirements.txt
├── roles
└── prometheus
├── defaults
│   └── main.yml
├── handlers
│   └── main.yml
├── meta
│   └── main.yml
├── molecule
│   └── default
│       ├── create.yml
│       ├── destroy.yml
│       ├── INSTALL.rst
│       ├── keypair.yml
│       ├── molecule.yml
│       ├── playbook.yml
│       ├── prepare.yml
│       ├── security_group.yml
│       └── tests
│               ├── test_default.py
│               └── test_default.pyc
├── README.md
├── tasks
│   └── main.yml
└── vars
└── main.yml
Edit the create.yml file to use the AWS settings for the creation of your machines. Copy the lines in bold and add the security group ID (already created):
[...]
  vars:
    molecule_file: "{{ lookup('env', 'MOLECULE_FILE') }}"
    molecule_instance_config: "{{ lookup('env', 'MOLECULE_INSTANCE_CONFIG') }}"
    molecule_yml: "{{ lookup('file', molecule_file) | molecule_from_yaml }}"
    aws_access_key: "{{ lookup('env', 'AWS_ACCESS_KEY') | default }}"
[...]
    - name: Create molecule instance(s)
      ec2:
          key_name: "{{ keypair_name }}"
          image: "{{ item.image }}"
          instance_type: "{{ item.instance_type }}"
           vpc_subnet_id: "{{ item.vpc_subnet_id }}"
          group_id: “[security_group_id]”
          instance_tags:
                 instance: "{{ item.name }}"
                 molecule-id: "{{ item.name }}-{{ aws_access_key }}"
             wait: true
          assign_public_ip: true
          exact_count: 1
          count_tag:
              molecule-id: "{{ item.name }}-{{ aws_access_key }}"
      register: server
      with_items: "{{ molecule_yml.platforms }}"
      async: 7200
      poll: 0
[...]
And the molecule.yml file. Fill the subnet ID:
---
dependency:
  name: galaxy
  enabled: False
driver:
  name: ec2
lint:
  name: yamllint
platforms:
  - name: monitoring-server
    image: ami-1b791862
    instance_type: t2.medium
    vpc_subnet_id: [subnet_id]
provisioner:
  name: ansible
  lint:
    name: ansible-lint
scenario:
  name: default
verifier:
  name: testinfra
  options:
    sudo: True
    v: True
  lint:
    name: flake8
Testing our first role
Now, you can launch the first tests and start develop your Prometheus role.
(We will not detail the Prometheus ansible playbook in this article).
If you follow the TDD methodology, you should write the first lines in your molecule test file (test_default.py serve as a template) and then start writing your prometheus role task files.
For example, we want to check that Prometheus package is installed:
import os
import testinfra.utils.ansible_runner
import urllib2

testinfra_hosts = testinfra.utils.ansible_runner.AnsibleRunner(os.environ['MOLECULE_INVENTORY_FILE']).get_hosts('monitoring-server')

def test_prometheus_service_is_running(host):
    prometheus_service = host.service('prometheus')
    assert prometheus_service.is_running


def test_prometheus_is_accessible_on_port_9090(host):
    host_ip = host.interface("eth0").addresses[0]
    response = urllib2.urlopen(ip+':9090')
    assert len(response.read()) > 0
Now we can execute the test, by typing the following command in your role folder (roles/prometheus):
$ molecule test
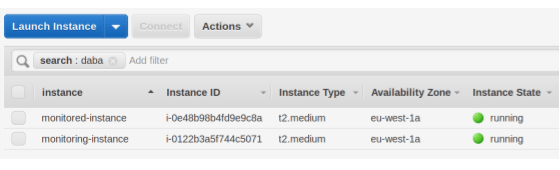
At this moment, the first magic trick is happening. If you go to the Amazon Console, you will see an EC2 instance launching, running and destroying itself during the test.
Testing your monitoring system
We have two fully tested and functional roles: Prometheus and Grafana. It would be really great to see them work together.
We will need to set up a new Molecule scenario dedicated to the full configuration testing.
For that purpose, we recommend having a new Molecule folder outside the roles. We create a specific folder called integration_tests at the root of the project. After that we will simply copy the Molecule folder from one of our roles (Prometheus for example).
You can also rename the default folder so that your scenario name will be more explicit.
$ cp -r roles/prometheus/molecule integration_tests/
$ mv integration_tests/molecule/default/ integration_tests/molecule/monitoring_stack/
In order to change the scenario name, we also need to edit the molecule.yml file :
[...]
scenario:
  name: monitoring_stack
[...]
So, you should have that following directory tree :
└── roles
    └── prometheus
                         └── ...
        └── grafana
                         └── ...
└── integration_tests
    └── molecule
                   └── monitoring_stack
                               ├── create.yml
                               ├── destroy.yml
                               ├── INSTALL.rst
                               ├── keypair.yml
                               ├── molecule.yml
                               ├── playbook.yml
                               ├── prepare.yml
                               ├── security_group.yml
                               └── tests
                                      ├── test_default.py
                                      └── test_default.pyc
This scenario will work quite similarly to the previous one. All we have to do (more or less) is to edit the playbook.yml file. At first, the file should look like this:
---
- name: Converge
  hosts: monitoring-server
  roles:
    - role: prometheus
We will add another role to the file to have grafana installed on the same host as Prometheus:
- name: Converge
  hosts: monitoring-server
  roles:
    - role: prometheus
    - role: grafana
Now, when you run our molecule command inside the folder (integration_tests), you will see your newly created scenario with molecule list. If you execute the following command, the ec2 instance will now receive the installation of both prometheus and grafana:
$ molecule create -s monitoring_stack
$ molecule converge -s monitoring_stack
“That’s nice indeed. But how that is supposed to test my entire config? Should I connect to the EC2 instance to see if it works?” Actually, you can connect to the instance with:
$ molecule login -h monitoring-server -s monitoring_stack
However, you can also automate this testing task.
In the molecule/tests folder, write a test_monitoring_stack.py file, that will allow to tests that integration is working correctly :
import os
import testinfra.utils.ansible_runner

testinfra_hosts = testinfra.utils.ansible_runner.AnsibleRunner(
    os.environ['MOLECULE_INVENTORY_FILE']).\
    get_hosts('monitoring-server')


def test_prometheus_api_is_healthy(host):
    cmd = host.run('curl --fail -u admin:admin http://localhost:9090/api/v1/label/__name__/values')
    return_code = cmd.rc
    output = cmd.stdout
    expected_output = '"status":"success"'

    assert return_code == 0
    assert expected_output in output


def test_grafana_is_well_configured(host):
    cmd = host.run('curl --fail -u admin:admin http://localhost:3000/api/datasources')
    return_code = cmd.rc
    output = cmd.stdout
    expected_output = '"type":"prometheus"'

    assert return_code == 0
    assert expected_output in output


def test_dashboard_is_well_created(host):
    cmd = host.run('curl --fail -u admin:admin http://localhost:3000/dashboard/db/db_server_monitored')
    return_code = cmd.rc
    output = cmd.stdout
    expected_output = '"name":"prometheus"'

    assert return_code == 0
    assert expected_output in output
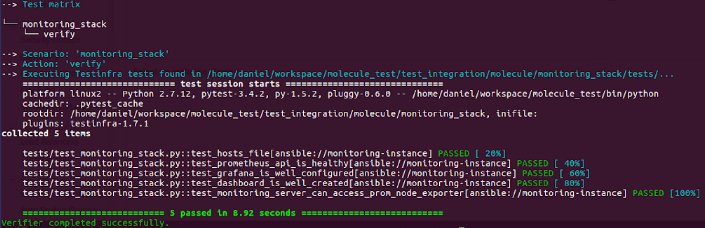
In our case, we decide to implement 3 differents tests to be sure grafana can source the data from Prometheus:
- test the Prometheus api : all the key metrics are available in the api
- test the Grafana datasource : Prometheus is registered as a datasource
- test a dashboard : first dashboard is created
We could have worked on a single test that would prove that the integration is working well such as getting the last displayed metrics in the Grafana dashboard.
However, the way Grafana rendered on a webpage would have lead us to use another testing framework like phantomJS (headless webkit testing).
Everytime we launch `molecule test` on this scenario, we will automatically test the integration of both Prometheus and Grafana.
Testing a more complex system
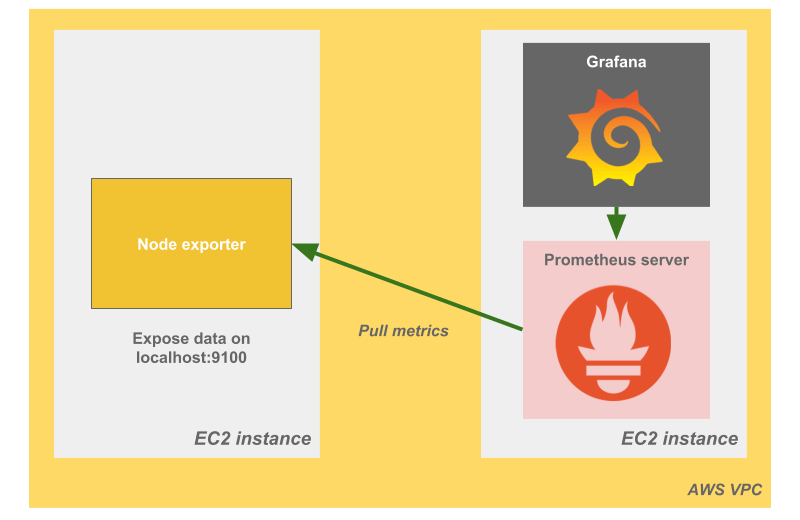
So far, we have tested a system on a single virtual machine which is good, but not representative for a full production case. Let’s add a Prometheus Node Exporter component which will deliver data (CPU, memory usage, etc.) from a monitored server. We configure the Prometheus server to scrape the metrics displayed on a specific port of this new server.
In order to deploy that configuration, we first need to edit the molecule.yml file:
---
dependency:
  name: galaxy
  enabled: False
driver:
  name: ec2
lint:
  name: yamllint
platforms:
  - name: monitoring-server
    image: ami-a5b196c0
    instance_type: t2.micro
    vpc_subnet_id: [subnet_id]
 - name: monitored-server
    image: ami-a5b196c0
    instance_type: t2.micro
    vpc_subnet_id: [subnet_id]
provisioner:
  name: ansible
  lint:
    name: ansible-lint
scenario:
  name: default
verifier:
  name: testinfra
  options:
    sudo: True
    v: True
  lint:
    name: flake
With that modification, everytime we execute molecule on that scenario, two EC2 instances will be created.
Now, we go to the playbook.yml:
---
- name: Converge
  hosts: monitoring-server
  become: true
  roles:
    - role: prometheus
    - role: grafana

- name: Converge
  hosts: monitored-server
  become: true
  roles:
    - role: prometheus-node
And that’s it!
Now we can write some integration tests to make it automated. Here is an example of a specific test for our monitoring system.
We want to make sure the Prometheus instance can access the URL metrics exposed by the prometheus-node.
import os
import testinfra.utils.ansible_runner

testinfra_hosts = testinfra.utils.ansible_runner.AnsibleRunner(
    os.environ['MOLECULE_INVENTORY_FILE']).\
    get_hosts('monitoring-server')

[...]

def test_monitoring_server_can_access_prom_node_exporter(host):
    monitored_host = testinfra.get_host('ansible://monitored-instance?ansible_inventory='+os.environ['MOLECULE_INVENTORY_FILE'])
    ip_monitored_host = monitored_host.interface("eth0").addresses[0]
    cmd_curl_node = 'curl --fail ' + ip_monitored_host + ':9100/metrics'
    cmd = host.run(cmd_curl_node)
    return_code = cmd.rc

    assert return_code == 0
Try to run the 'molecule test' command to see the results.
Going further
In order to be sure that your Ansible code is nice and work well after some refactoring, you can add your `molecule testing` into your CI pipeline.
We did it with Gitlab-CI and it’s working pretty well.
The hard part is to make your Gitlab communicate with AWS (setting keys is a full topic by itself).
If you want some inspiration for your gitlab-ci.yml configuration, here is an example :
stages:
- test

before_script:
  - apt-get install -y git > /dev/null
  - pip install -r requirements.txt --quiet

image:
  name: [image_name]

Role prometheus molecule:
  stage: test
  variables:
    AWS_REGION: eu-west-1
  script:
    - ./install_deps.sh
    - cd integration_tests/
    - molecule test -s [scenario_name]
Conclusion
We have tested the installation at a role level: Prometheus, Grafana, Prometheus Node Exporter. We also have written tests to make sure the components can connect to each other. Finally, we ensure that the full configuration (server instances, network, services…) is working fine on ISO production conditions (ie. AWS).
Furthermore, it is possible to build a fresh infrastructure and destroy it on demand in (a few) minutes: no more side-effects on existing configuration as you test on dedicated and ephemeral instances.
I will not say it is costless to deploy the whole automation stack. However, we now have a way to test what we want to deploy in production and ensure a way to validate future evolutions.
Cheers,