System flow monitoring: an example
Having written about monitoring flow and best practices for setting it up, let's move onto a practical example. We'll define a mini-information system combining services and messages, then we will show how to monitor it, including technical explanation and the full code.
The application components presented in this article have generic names (frontend, middle-end and backend) so that everyone can easily adapt them to their own context. We could, for example, imagine frontend like an mobile application or a single-page javascript application, the middle-end like a layer of REST services (APIs), and finally the backend as a persistent system or transaction analysis.
About the code
The code proposed in this article was written for illustrative purposes. It is therefore as simple as possible and does not include things like error management or optimisation. It's up to you to inspire yourself and adapt it (we released it under the open source Apache license) but above all, do not reuse it as is.
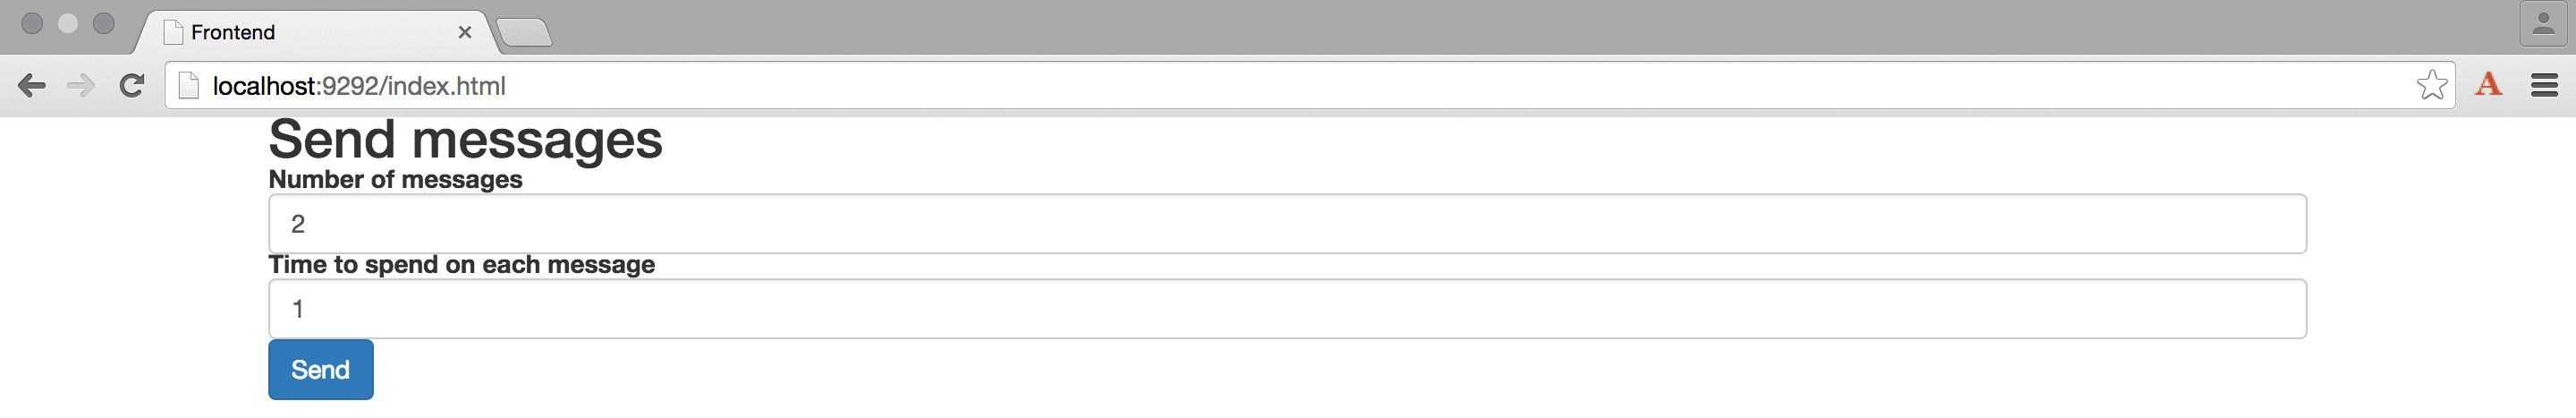
The steps to test the code yourself are described in the project documentation.
In order to keep this article short, we used hyperlinks rather than inline source code. If portions of the code seem unclear to you or you have any suggestions, please create a ticket; and if you have ideas for improvements, pull requests are welcome.
The system
The first article explained that business services have two properties:
- they can combine multiple service calls and/or message sending
- they can combine heterogeneous technologies
An information system that combines these two aspects requires flexible monitoring tools and should be based on interchangeable technologies.
The application architecture presented here takes into account these elements:
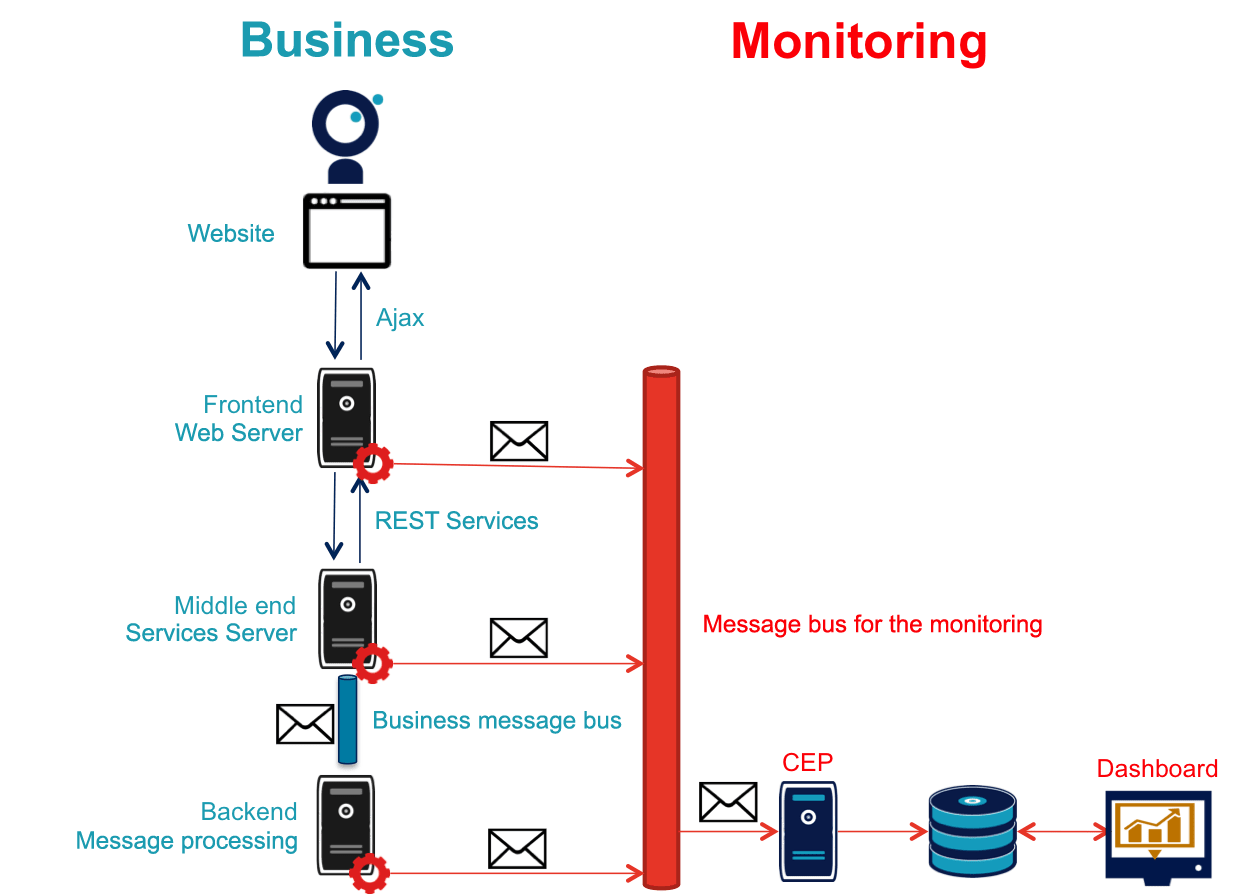
Business side:
- A frontend server that exposes a service and uses a website with a form
- A middle-end server providing two services for the frontend
- A backend server processing asynchronous messages published by the middle-end on a bus
Monitoring side:
- A monitoring module in each application component
- A dedicated bus receiving messages from each of these modules
- A CEP server for processing these messages to create alerts and produce KPIs
- A database indexing the messages and information generated by the CEP
- A dashboard tool to present monitoring information
Format of monitoring messages
Defining the monitoring messages format is crucial, even if the processing system must be designed to easily adapt to different cases. The use of a common template simplifies the messaging operation in the CEP and the dashboard.
In our case, we chose to use messages in JSON format:
{
    "correlation_id": "octo.local_MonitoringBase_24389_2015-01-30 11:05:29 UTC_36cddd01-7bcd-4ced-8024-919ff1dbe6ca",  // correlation ID

    "timestamp": "2015-01-30T12:05:29.230+01:00", // timestamp of the msg
    "module_type": "FrontendApp", // name of the module name that sends the message
    "module_id": "FrontendApp_octo.local_001", // identifier of the module that sends the message
    "endpoint": "GET /messages", // name of the service
    "message_type": "Send message to backend", // type of the message

    "begin_timestamp": "2015-02-19T22:11:15.939+01:00", // optional: timestamp of the start of the action
    "end_timestamp": "2015-02-19T22:11:15.959+01:00", // optional: timestamp of the end of the action
    "elapsed_time": 0.020169, // optional: time elapsed during the action

    "service_params": {
        // optional: parameters of the service
    },

    "headers": {
        // optional: headers of the service (http headers for example)
    }

    "result": {
        // optional: return value of the service
    }
}
Details of each component
About monitoring
To provide the necessary data, each component embeds code in order to retrieve the relevant information to copy them on a bus. To minimize the impact on the application code, message sending is done in a dedicated thread and exception management separates the monitoring code from the business code.
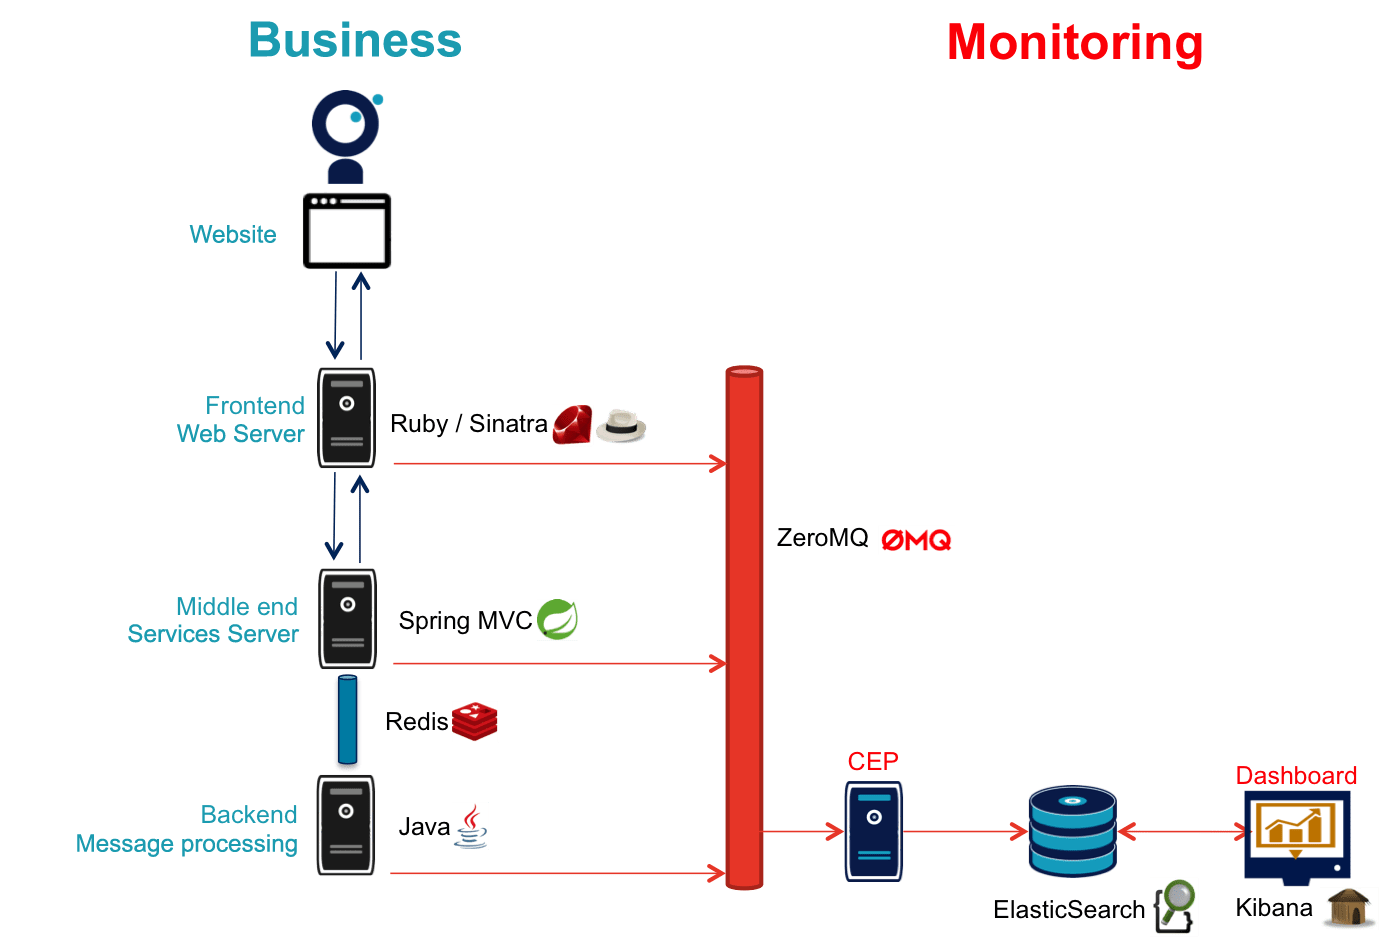
Following the recommendations of the first article, we selected ZeroMQ as the monitoring bus for its excellent performance.
Frontend
The frontend server is made with Ruby and uses the web framework Sinatra which is perfect to easily demonstrate web services.
- app_base is where you set the core application parameters, and provides a way to call the services of the middle-end server
- The static directory contains the web site
- frontend_app exposes the business side service which calls the website and two middle-end services consecutively
Monitoring
The monitoring code is located in the class monitoring_base.rb.
The Sinatra framework provides the entry points needed for the monitoring with before and after methods where all the information of the current request is accessible. To store information during the execution of the request, such as the start time of the execution, a field is added to the Request class.
The method for calling services is overidden for two purposes:
- Send copies of service calls to the monitoring system
- Add http headers to the service call to transmit the correlation ID as well as the time of the call
The data is posted in a queue and exists in a separate thread.
Middle-end
The middle-end server uses Spring. Spring Boot allows easy configuration of an application and Spring MVC allows the use of REST services.
- MiddleEndController contains the controller that exposes both exposed services
- RedisProvider provides access for the bus to send messages to the backend
Monitoring
Because of the choice of Spring technology, the monitoring set-up requires some special handling:
- A HandlerInterceptor provides an entry point at the beginning and the end of the execution of each HTTP request for creating messages that will be sent to the monitoring side
- It is necessary to subclass the HttpServletRequest to be able to store information during the execution of the request such as the start time of its execution
- Finally, HttpServletRequest that represents the query and HttpServletResponse that represent the response, do not give access to the content of the request nor to the response because their package is streamed. It is therefore necessary to bundle both classes to save the contents during transmission and thus be able to read them later
The result is divided into 5 classes:
- MonitoringServletRequest represents the request; it provides some utility methods including correlation identifier recovery and uses RecordingServletInputStream to save the contents
- RecordingServletResponse represents the response and saves the contents using RecordingServletResponse
- MonitoringInterceptor is the interceptor that sends messages by retrieving information from the request and response
The code responsible for sending messages is located in a shared project because it is used by the middle-end and back-end. The useful code is located in MonitoringMessageSender which uses a dedicated thread to send messages and rely on a queue. RedisProvider was changed to transmit the correlation identifier in messages sent to the backend.
The application bus
It is a Redis server: it is mainly used as a key-value cache, but its API makes it a suitable message bus. Its main advantages are its simple usage and its processing speed.
The backend
We simulated a message processing application using a thread pool:
- ApplicationBase provides the base application that receives the messages from Redis and gets processed by a Java thread pool
- Backend processes the messages
Monitoring
Since the reception code is specific to the application, monitoring is fully integrated with the application base. For sending messages, it relies on the same shared project as the middle-end.
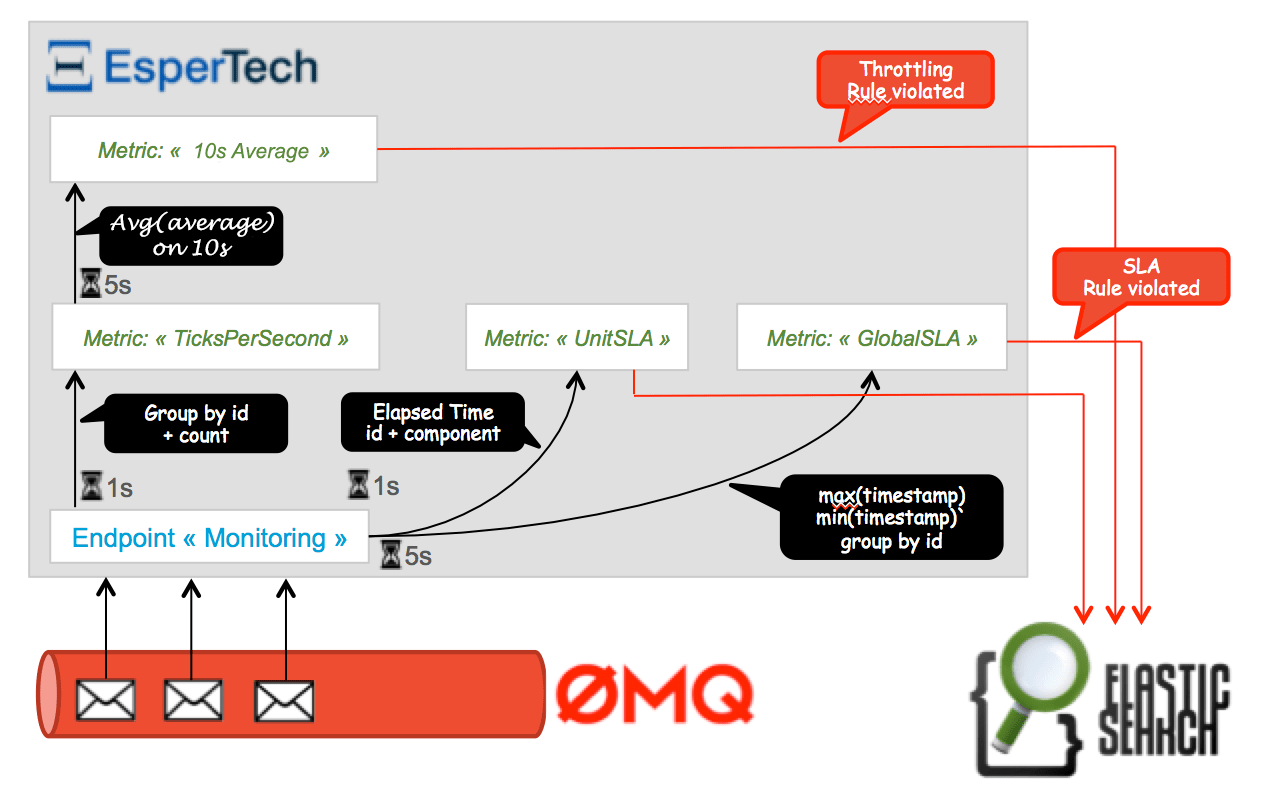
Complex Event Processing
Principles
The Complex Event Processing component sends messages from different modules (frontend, middle-end, backend). In parallel, it performs database inserts and updates memory status. The evolution of this state can generate alerts which will be persisted into the database.
It is implemented in Java using the integration framework Apache Camel and comes as a standalone application.
- Messages are popped from ZeroMQ using a Connector that we had to rewrite using the jeroMQ library. The existing component worked with non-applicable Scala bindings.
- The memory state and alert notifications are implemented using the Esper framework. Camel provides the connector to bind to it. The rules are written with the internal DSL named EPL (Event Processing Language) in the Camel configuration file.
- Messages and alerts are persisted in an ElasticSearch cluster with the help of a home made connector using the library Jest (it is therefore not designed for scalability). The default connector is recorded as a node of the ElasticSearch cluster and that makes the local tests more complicated.
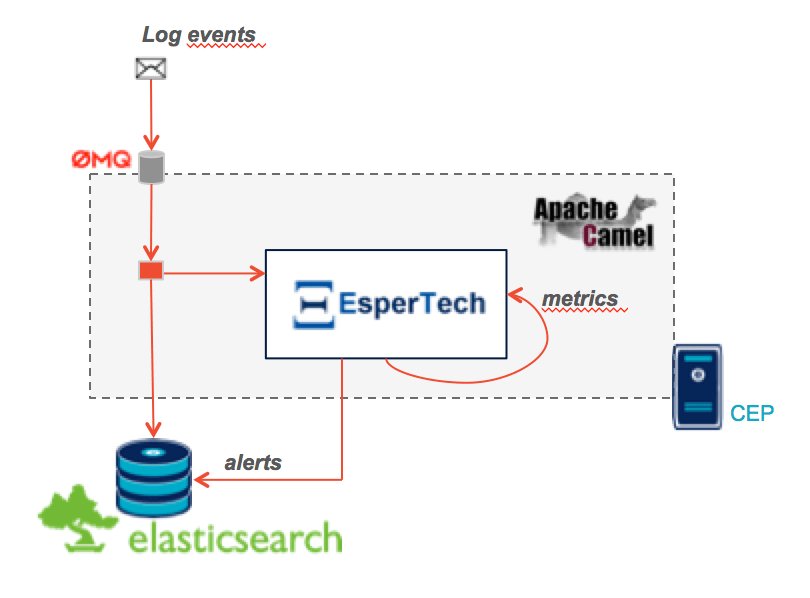
Event interpretation
The flow of events is analyzed to build real-time indicators thanks to Esper Process Language (EPL) analytical language. These statuses are queried periodically to detect abnormal behaviors such as threshold violations.
We've tried to demonstrate three types of alerts:
- Excessive processing time for one of the components using the attribute
elapsed_timeof the messages. - Excessive processing time for an execution on the entire chain, using the correlation identifier.
- Throttling: The number of calls exceeding a threshold set in a fixed time unit (here an average of more than 3 calls in 10 seconds).
The monitoring database
It is based on Elasticsearch which automatically indexes the data when it is inserted. For data to be indexed in the best way possible, simply create an index beforehand so that the fields are indexed the right way.
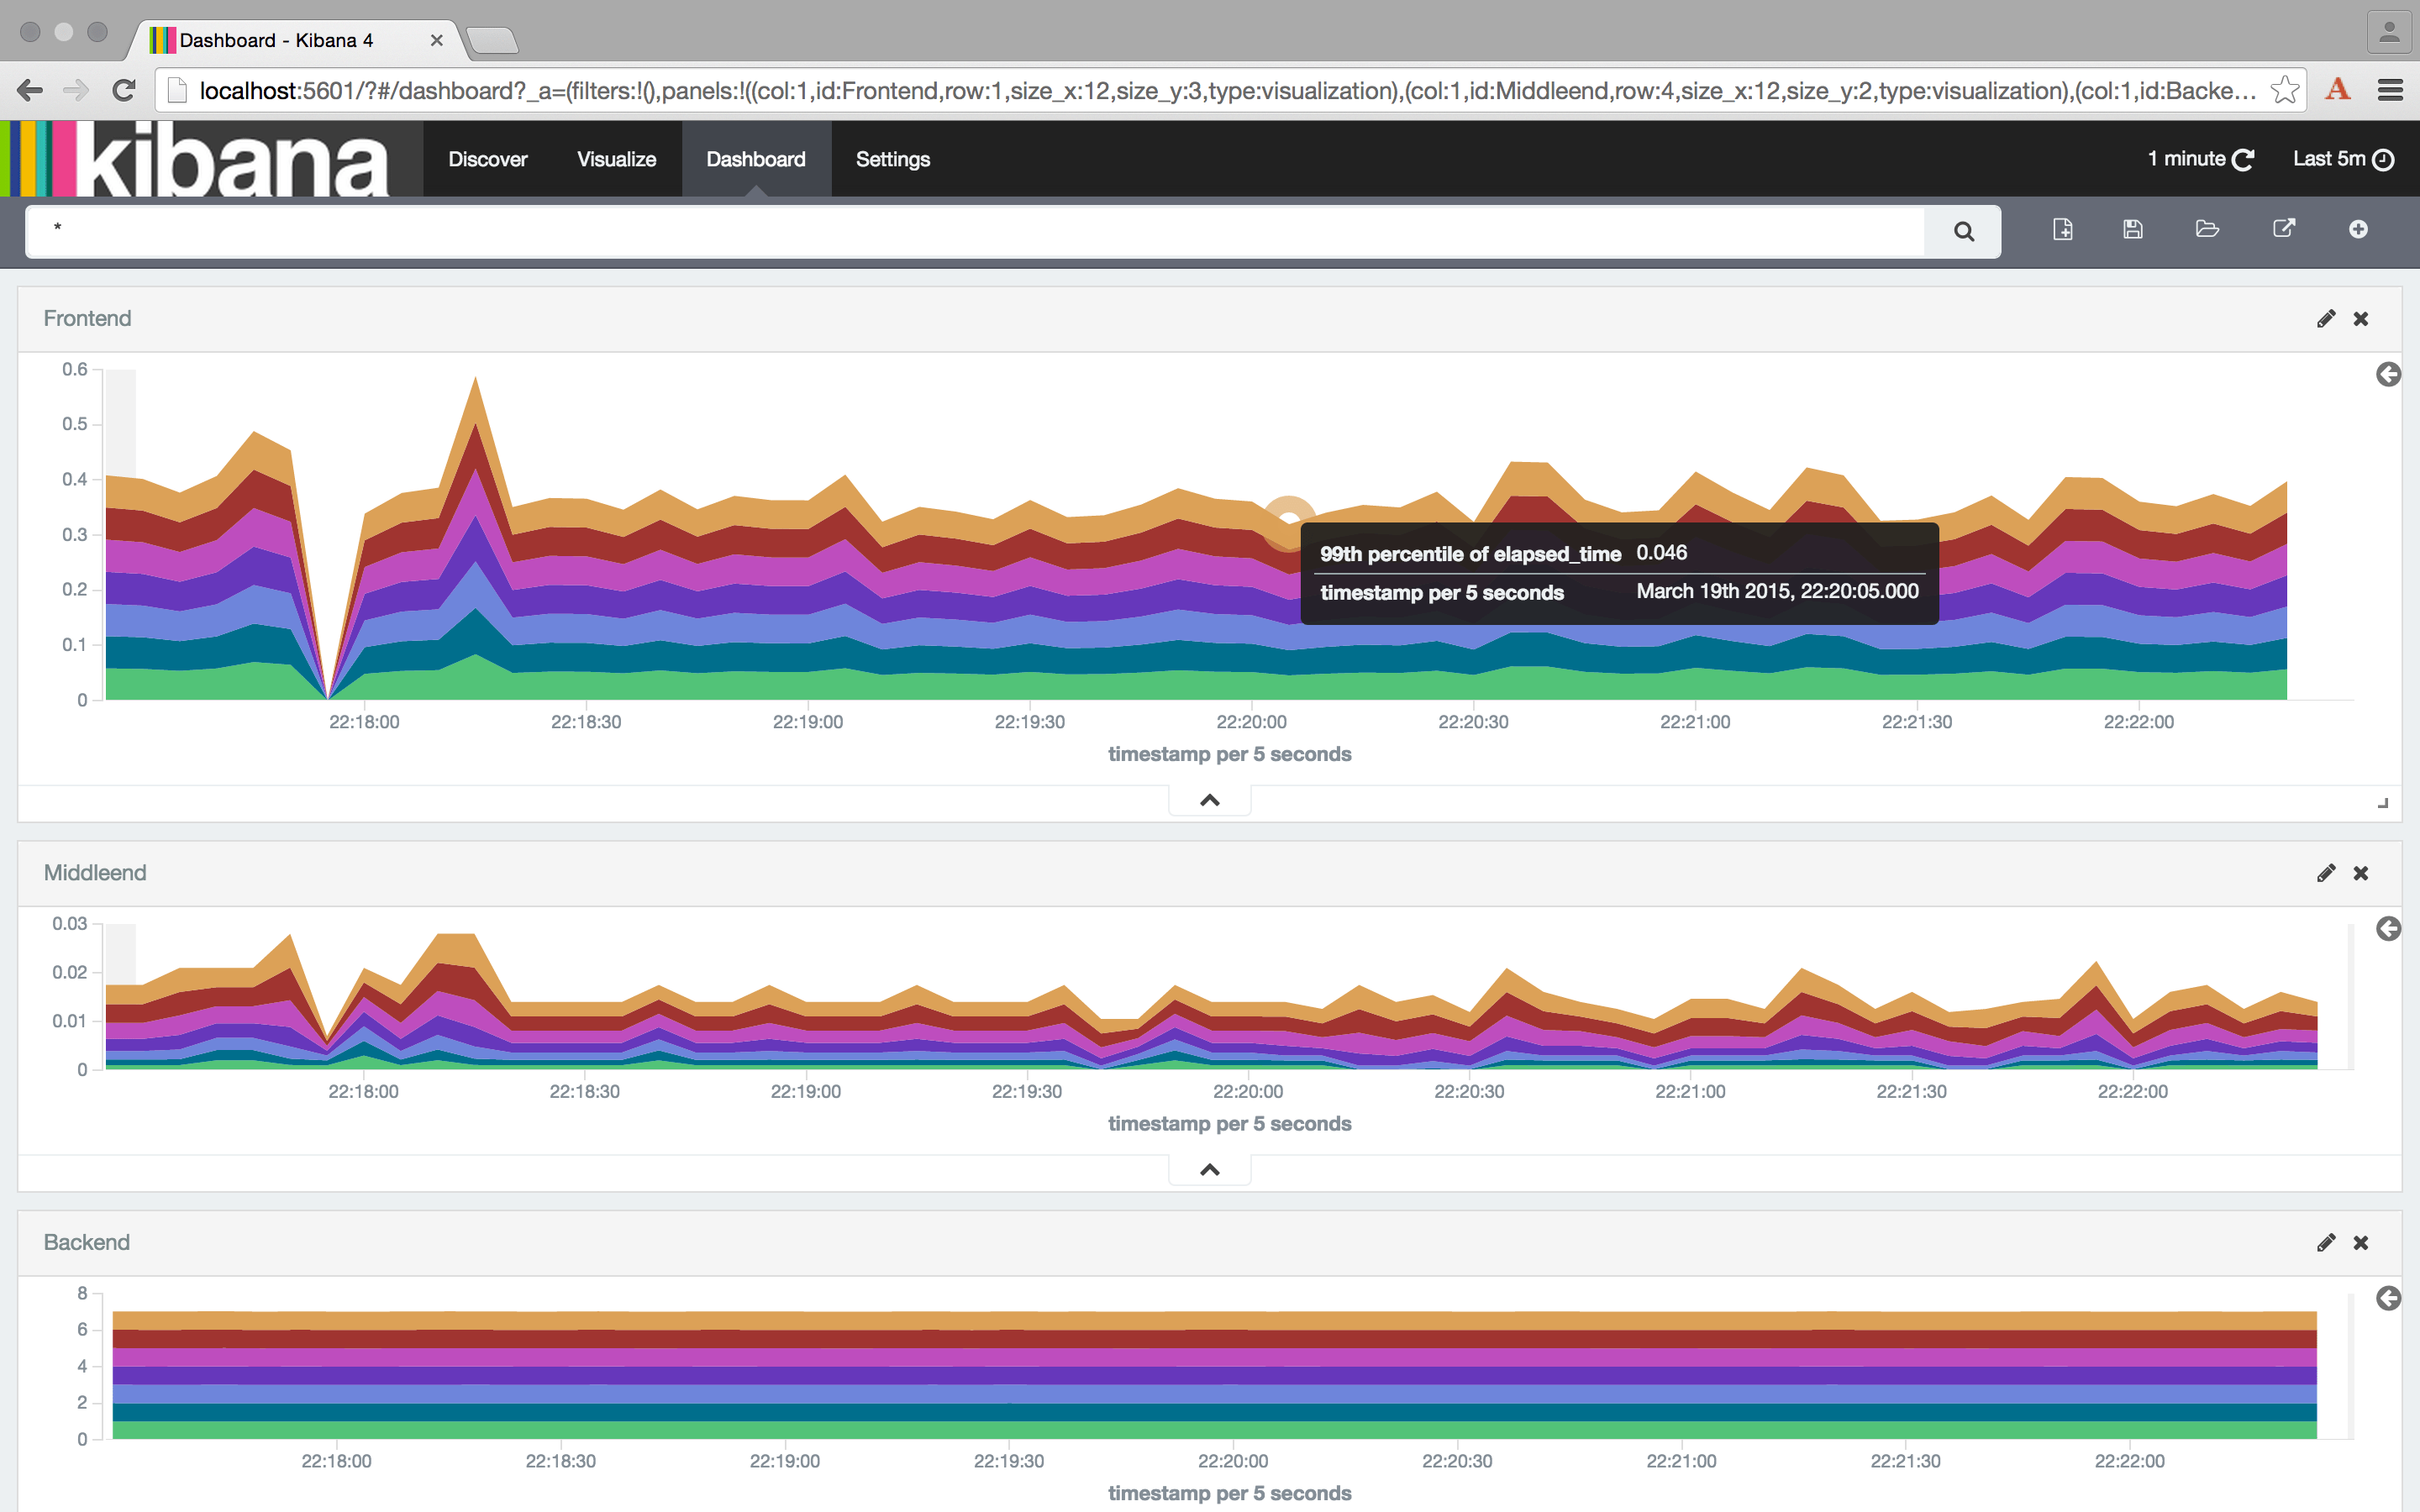
The dashboard
With the data already structured and stored in ElasticSearch, Kibana is the natural choice for the dashboard: assistant wizards make it easy to create various dashboards based on the data in the database.
For example, a dashboard of the percentiles calls on different servers (the configuration is available in the source code):
Monitoring-adverse components
The cases presented here are friendly because the components are not too complicated to monitor, even if the middle-end requires some special handling. Unfortunately throughout any IS of a certain size, there is always at least one "black box" brick, like a portal or an e-commerce platform, that is difficult to properly equip. For these components, there are generally two choices available:
Use the extensions provided by the tool
This solution is the most consistent. However, these APIs are often of inferior quality. So, before starting using them, three things must be checked:
- Is the documentation sufficiently detailed, particularly where internal objects are exposed?
- Are the APIs stable? Since these APIs are fairly close to the engine tools, they are more likely to change from one version to another.
- Are all the data you need exposed?
Depending on the answers to these three questions, the second solution might be a better choice.
Use a proxy
If the exchanges with the component are made through http, another solution is to set up a proxy like nginx to generate the monitoring messages. By configuring the logs, you should be able to get all the information you need, and a custom component is needed to push them to the CEP server. This solution has the disadvantage of adding an additional infrastructure layer, but avoids the need to develop too much code for a specific tool.