SQLFire from the trenches
In a first article, I have explained why I think that NewSQL is a disruptive storage technology designed for traditional Information Systems. NewSQL relies on a scalable architecture and is designed to run on commodity hardware. In order to get actual figures for SQLFire, we have built a Proof of Concept for stress test purposes. The goal of this article is to give you some feedback on these stress tests in the chosen scenario.
The first sections provide a description of the test environment and hypotheses, as well as some feedback from our experience on the stress test protocol that we have used. If you trust our hypotheses and are mainly interested in NewSQL figures, go directly to the SQLFire feedback paragraph.
POC architecture
The applicative stack is Java Spring based, with a very conservative design. The goal is to model applications which are common in current Information Systems. The persistence tier has been implemented both with MySQL and SQLFire. We took advantage of the SQL interface of SQLFire as described in the previous article.
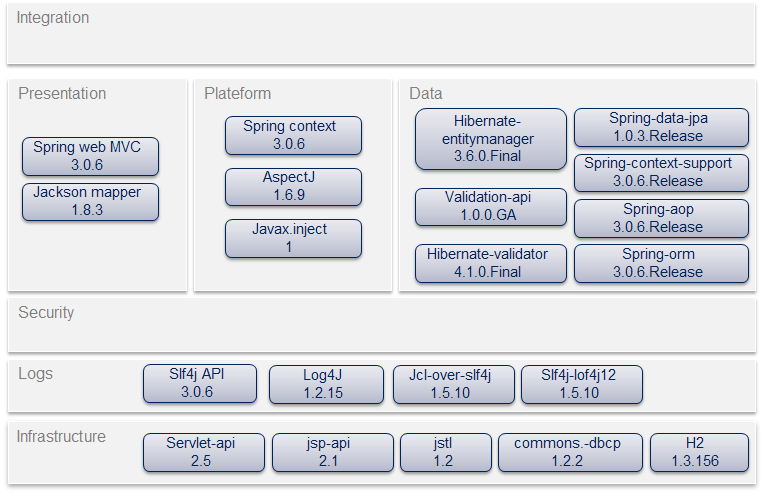
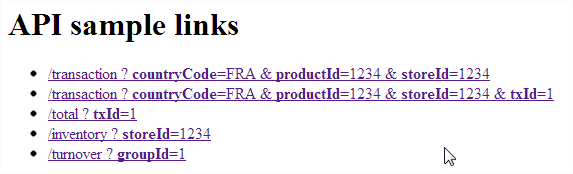
The application exposes requests through a HTTP API which returns JSON responses. It does not fully implement REST principles, but from a server point of view it is equivalent to an API consumed by modern single page javascript applications.
Stress tests description
Data generation
Stress tests have been performed with the Gatling tool in order to determine the sustainable performance level of both MySQL and SQLFire. We have used 3 scenarios:
- Transaction scenario: this one is purely transactional. A first article is bought, then after 1 or 2 seconds, a second article is bought, then after 2 or 3 seconds the receipt is emitted. As the
Stocktable is updated in a consistent manner, all 3 tables are updated by this scenario. - Inventory scenario: The inventory of a given store is queried every 5 to 10 seconds, in order to simulate a back-office activity.
- Turnover scenario : The
SaleOperationtable is queried every 5 to 10 seconds in order to compute an overview of the turnover of a specified subset during a given period.
These scenarios are run concurrently with 850 virtual users for the transaction scenarios, 200 for the Inventory scenario and 200 for the turnover scenario. For the purpose of these tests, a substantial volume of artificial test data has been generated. The effort required by such data generation is frequently underestimated. Nevertheless, the two key requirements for the dataset are to be big enough and to be representative in term of data distribution. Indeed, sequentially generated numbers can lead to very different behaviors than real life data. We have chosen Databene generator as the dataset generator. Why is it good? The table below give you a subset of the Store table:
| id | apeCode | contactReference | dealerParametersReference | groupId |
|---|---|---|---|---|
| 1500 | 9305P | JOMUNA | RAMIRO | 29309 |
| 1501 | 5742R | RUPO | SIPU | 54435 |
| 1502 | 6867K | BOTILO | SAZORU | 84726 |
| 1503 | 4139H | LOPU | ZUBA | 89186 |
| 1504 | 2874A | BOSUNO | MUTA | 7736 |
| 1505 | 2544Q | LIFUTU | ZUTO | 26976 |
| 1506 | 3822S | MORODA | POVUCE | 51560 |
| 1507 | 1449S | JIJI | ROJONU | 93844 |
| 1508 | 7867G | ZISA | FENUFO | 36446 |
| 1509 | 2327R | RADISA | BEBE | 24972 |
You can notice that even if the technical id is simply incremented, the business apeCode and the other data look reasonably random.
The EC2 platform
Stress tests have been performed on the EC2 platform. The infrastructure is described in the diagram below: 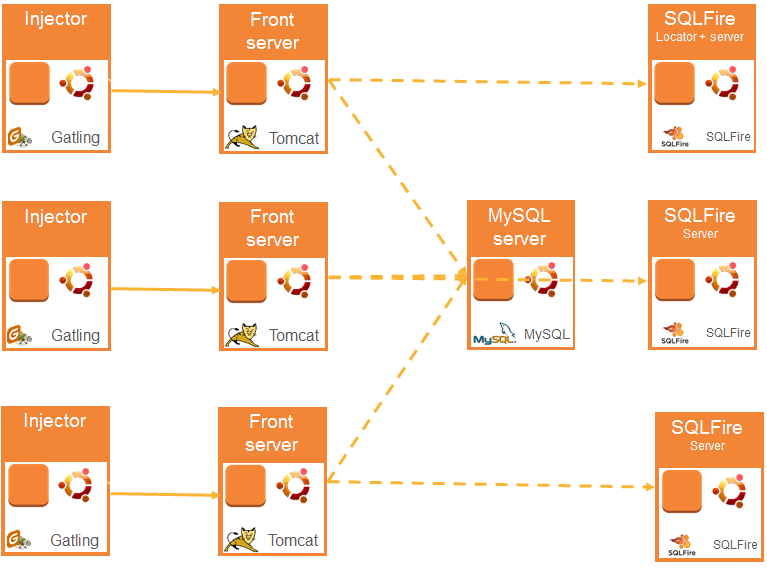
We have used several instances of Amazon EC2. Instances have been built from ubuntu images. We have not used Amazon RDS for MySQL in order to have a total control on the type of instances that we use. For equivalent reasons, we have not used Elastic Beanstalk because at the beginning of our tests (January 2012) fine tuning was not available.
To ease the tedious task of setting up a stress test platform over and over, we have chosen industrialization. We have used knife to automate the creation of the EC2 instances, chef and chef-server to install and configure the applications. Three recipes have been used:
- base: which installs
apt, git, java, maven - app: which installs
tomcatover the base role - mysql: which installs
mysqlover the base role - sqlfire: which installs
sqlfireover the base role
Since there was no chef cookbook for SQLFire, we wrote ours. The recipe on itself was relatively easy with 3 files of less than 80 LOC. The trickiest part concerned the affectation of the locator role. (Small digression for clarity purpose: SQLFire uses a locator per cluster that is responsible for maintaining the cluster topology and serving it to clients and joining nodes. The first locator has to be unique and known by all the other nodes.) We used Opscode Chef server for that purpose. The first node to start registers as the default locator by storing its IP address on chef server. Each node that connects subsequently retrieves then the locator IP address from the chef server. A bunch of SSH scripts have been used to deploy the application on the tomcat servers and to launch the different Gatling tools.
Stress tests: what rocks and what has been learned
Concerning the environment
A cloud environment and particularly Amazon EC2 is the best platform to run stress tests. You can start with a lot of tests with very small instances, then launch many very large instances to test the scalability of your platform. From a project manager perspective, it is however necessary to provision about 1 day per developer to clearly understand the concepts, the billing, and install a fully operational workstation. Tooling for deployment is very useful. However, based on my experience, I would recommend to proceed a bit differently. Rebuilding a totally new environment with different software configuration was not needed in our case. A combination of AMI (amazon machine image) and automated configuration would have been sufficient. Our SSH scripts have been far more used than the Chef tooling which was probably overkill. Chef server is oversized. Launching our environments by providing the IP address of the locator as a parameter would have been easier to implement while being as efficient. Data generation: the quality of the generated dataset is good and the tool was simple enough to use (declarative XML syntax, maven integration). The relation between tables can be specified and the dataset takes them into account. Two difficulties should be mentioned: relation is managed in the process memory. The maximum dataset size for a single run is limited by the memory size. In our case, the dataset has been generated with several benerator runs. Time needed is a problem too as we reach a throughput maximum of about 4 millions of lines per hour. An alternative could have been running injection tests and then use the generated data. I recommend mixing both approaches: data generation is required in order to have significant results but can be deferred after the first load tests. The initial data can be completed later in an easier way by simply running some injection tests.
SQLFire feedback
Data modeling
The data modeling approach has been already described in the first article and is one of the best SQLFire aspect. The modeling theory is clearly established and the constraints are clearly compatible with our model.
Administration
SQLFire provides basic tools for backup, import and export. We started with sqlf write-data-to-db but the tool is not easy to use. Each update of the schema, even in the partitioning strategy, requires regenerating the db-schema.xml file. Moreover, the error message on the client importer is not clear. Our recommendation is using syscs_util.import_table_ex which is clearly described in this article. The error messages are much more understandable and the throughput is higher: we have been able to load 5 million lines in 32 minutes.
Memory sizing
Memory sizing was clearly the trickiest part of SQLFire. In order to have a fair comparison between MySQL and SQLFire we wanted to run the stress tests with the same amount of RAM for both systems. With SQLFire, for about 4.2 GB of CSV data and 19.5 billion lines, a 15 GB heap was required. With 3 JVM each with a 3 GB heap we were able to load the data but the system was not responsive. 15GB of RAM is a very large quantity for a MySQL server. We investigated in order to reduce this figure. First, in order to be efficient, SQLFire stores its index entirely in memory. With our normalized relational schema, we have 9 foreign key indexes and one standard explicit index on the largest table. By removing this explicit index I was able to load 4.2 GB of CSV in 6.15 GB of occupied heap. But in this case again, the system was not responsive. Next, SQLFire can overflow its data to disk by using such kind of directive create table ...EVICTION BY LRUHEAPPERCENT EVICTACTION OVERFLOW PERSISTENT SYNCHRONOUS;. Using this option was our first choice but it was inefficient in our case. Using this option was our first choice but it was inefficient in our case, as activating of deactivating this option does not lead to any behavior change in the heap footprint. This point is quite simple but not trivial. SQLFire stores the primary key of each table entirely in memory. Thus, the relative size of primary key over the total size of a record is important because our data model has relatively small columns and few columns per table. Even if the exact implementation of a primary key constraint in SQLFire is not described, remember that the size of a map with 100 empty objects indexed by integer is not 400 bytes but 68,168 bytes as described in this article. Future version of SQLFire will probably allow to overflow part of the primary keys to the disk. I'm therefore waiting for the final release note of this version.
Performance results
Stress tests have been performed both with MySQL and SQLFire on different EC2 instances. First the configuration of Tomcat has been updated in order to remove the bottleneck that appeared with about 150 HTTP req/s. We have used org.apache.coyote.http11.Http11NioProtocol with 8 acceptor threads. We have increased the number of files that can be opened by the tomcat process as each TCP connection is seen as a file in Linux. This was done by adding ulimit -n 8096 in /etc/init.d/tomcat6. The first test on SQLFire with an empty database on an m2.4xlarge instance demonstrated good response times at 2 000 concurrent users. The CPU usage was low (about 3%). The average throughput was measured at 435 HTTP req/s. Next stress tests have been performed on a database pre-filled with the data. MySQL was filled with 19.6 million of lines. Due to the aforementioned memory footprint limitations, we had to remain below 1 million rows for SQLFire. We have stressed the platform using the Gatling tool, with a ramp up adjusted until we noticed a plateau on the throughput while the number of concurrent users was still increasing. The response time was not limited in our test. The 99th. percentile of the response time was below 5 s. for MySQL and below 15 s. for SQLFire. For SQLFire the 95th. percentile was below 12 s. Here is the Gatling results corresponding to the first tests hereafter named Run A: 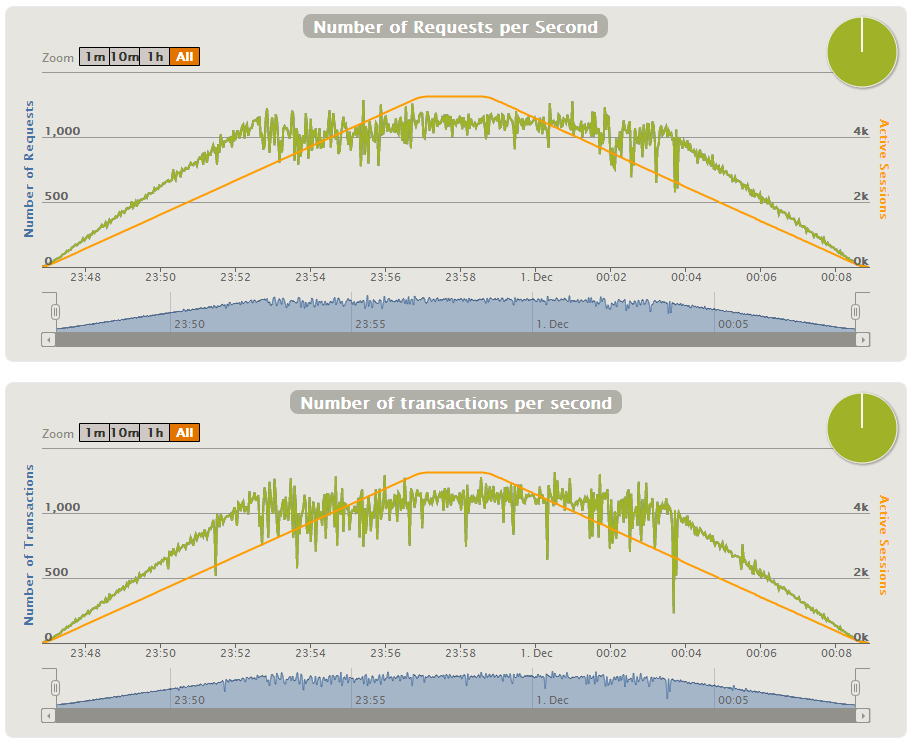
All the other results are summarized in this table:
| Stress test id | Run A | Run B | Run C | Run D | Run E | Run F | Run H |
|---|---|---|---|---|---|---|---|
| Nb. Rows | 1,90E+07 | 1,90E+07 | 934000 | 934000 | 934000 | 934000 | 934000 |
| Nb. Concurrent users | 5,25E+03 | 5,25E+03 | 5250 | 5250 | 1050 | 900 | 1050 |
| MySQL | 1 m1.large | 1 m1.large | |||||
| SQLFire | 1 m2.xlarge with a synchronous persistent schema | 1 m2.xlarge with a not persistent schema | 1 m1.small with a not persistent schema | 1 m1.small | 3 m1.small | ||
| Tomcat 5 | 5 c1.medium | 5 c1.medium | 5 c1.medium | 5 c1.medium | 1 m1.medium | 3 c1.medium | 3 c1.medium |
| Gatling | 5 m1.small | 5 m1.small | 5 m1.small | 5 m1.small | 1 m1.small | 1 m1.small | 3 m1.small |
| Inventory (avg req HTTP/s) | 33 | 33 | 25 | 26 | 6 | 10 | 11 |
| Transaction_new (avg req HTTP/s) | 241 | 236 | 133 | 138 | 34 | 48 | 43 |
| Turnover (avg req HTTP/s) | 33 | 33 | 25 | 26 | 6 | 10 | 11 |
| Transaction_with_txId (avg req HTTP/s) | 241 | 236 | 133 | 138 | 34 | 48 | 43 |
| Calculation of Total (avg req HTTP/s) | 241 | 236 | 133 | 138 | 34 | 48 | 43 |
| Grand Total HTTP (avg req HTTP/s) | 789 | 774 | 449 | 466 | 114 | 164 | 151 |
| Max grand Total HTTP (max req HTTP/s) | 1100 | 1081 | 550 | 550 | 150 | 200 | 300 |
To sum these results up, in our use case, the throughput of MySQL is greater than the throughput of SQLFire even if SQLFire is executed on a bigger instance.
After further investigations, the MySQL architecture reaches its plateau when the MySQL server is saturated. The disk IO are quite high but it is not the key of the saturation. The IO level on the network are relatively reasonable too. This screenshot shows a very high level of system CPU.
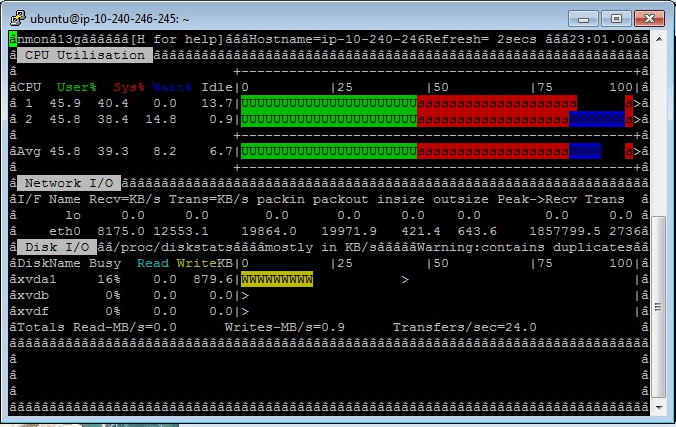
I presume that it is due to a lot of concurrent network connections. As the available memory on the MySQL server was high we have increased the dataSource.pool.maxActive parameter on the JDBC pool and the max_connections in /etc/mysql/my.cnf. Several tests with lower values leaded to errors due to no available connection. This level could be further tuned but it gave us a good reference for MySQL performance. Our main conclusion is that MySQL can do aggressive caching in our use case. The throughput of the data to write is easily sustainable with the disks used on EC2. Our application is transaction intensive which corresponds to the use case that we would like to test on SQLFire.
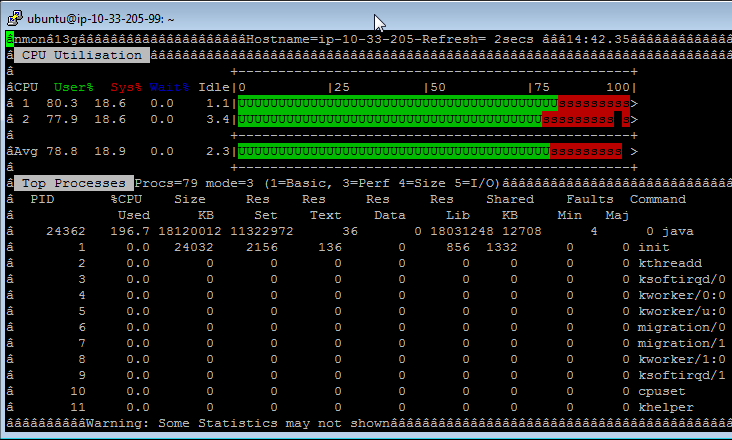
Comparison with SQLFire results shows that the transaction request has half the throughput of MySQL's. As shown in the following screenshot, the whole CPU is consumed by the Java process of SQLFire.
In order to understand the difference we first look at the SQL queries generated by our HTTP requests. For each business transaction we get these SQL queries:
| HTTP request | Insert | Update | Select |
|---|---|---|---|
| Inventory | 1 | ||
| Turnover | 1 | ||
| Transaction_new | 2 | 2 | 6 |
| Transaction_with_txId | 1 | 1 | 8 |
| Total for Transaction | 1 |
By combining these figures and the figures of the Gatling reports we got an estimation of 6 000 SQL queries/s. for MySQL and 3 200 SQL queries/s. for SQLFire. This is quite high but it does not explain why SQLFire has a smaller throughput.
We then looked at the GC usage. During the run C, our GC analysis shows that total GC time is 425 ms. for 450 s. of execution time. The 1.6GB heap is only occupied at 1GB. Other measures show 50s. of GC for 30 min. of run. The GC impact is far below 3% of the CPU usage. We then checked that the queries were correctly tuned for SQLFire. As the data are stored in memory, we would like to be sure that full scan did not lead to this overconsumption of CPU. First, take into account that MySQL and SQLFire schema are defined with the same index. Analysis of the query plans shows the following results
| CONSTRAINTSCAN | 22 |
| INDEXSCAN | 1 |
| ROWIDSCAN | 19 |
| TABLESCAN | 0 |
The worst case seems to be a constraint scan which should not be problematic according to the documentation.
Gemfire which is the low level layer of SQLFire, provides some interesting metrics. We have activated a metric collection every 500 ms. on a small m1.small machine. We noticed a peak at 14 concurrent connections. The maximum throughput was 178 gets/s. on the Store, Transaction and Country regions. During update, we reached 235 update or create per second. This can be the sign of a throughput limit for our small machine with 1 vCPU. However we reach more than 10 000 create/s. during insertion.
Lastly we look at the thread dump of SQLFire. During this period we got the following distribution:
| Thread.State | Nb. of threads startup | Nb. of threads with 600 concurrent users |
|---|---|---|
| RUNNABLE | 817 | 416 |
| TIMED_WAITING (on object monitor) | 10 | 10 |
| TIMED_WAITING (sleeping) | 2 | |
| WAITING (on object monitor) | 14 | 415 |
| WAITING (parking) | 10 | 10 |
At startup, the runnable threads are quite uniformly spread in SQLFire. 3 hotspots can be localized with 165 threads processing the network in com.vmware.sqlfire.internal.impl.drda.DDMReader.fill, 133 threads in com.vmware.sqlfire.internal.impl.drda.DRDAConnThread.parseEncodedString and 140 other threads in com.vmware.sqlfire.internal.impl.drda.DRDAConnThread.parseCcsidMBC. When the number of concurrent users increases, the repartition is different. For example with 600 concurrent users, 406 threads are processing the network in com.vmware.sqlfire.internal.impl.drda.DDMReader.fill and 401 threads are waiting in com.vmware.sqlfire.internal.impl.drda.NetworkServerControlImpl.getNextSession. My analysis draws me to conclude that SQLFire is in general CPU consuming but becomes finally becomes limited by the network processing when the number of concurrent users increases. However, we can't get more details in the documentation nor can we tune parameters in order to go beyond this limitation.
Conclusion
This Proof of Concept has allowed us to identify SQLFire strengths and weaknesses. The use case and product combination that we have chosen were not the good ones. A relatively small platform is not effective for SQLFire which has a high overhead in memory occupation and CPU consumption. Using SQLFire on one node is clearly not a good choice. The supposed latency benefit of the in-memory storage was totally invisible in our use case thus there is no visible advantage into using SQLFire for this purpose. The overhead becomes larger with a distributed architecture and we could not run this architecture properly on the small platform we had chosen. Finally SQLFire is a relatively small products. Data loading tools are not always effective, architecture limitation leads to a very high memory consumption. Next version will probably to solve some part of these problems. As it is today, SQLFire cannot be a MySQL one-to-one replacement on EC2. The VMWare benchmark described in the sqlfire best practices guide may lead to such conclusion as it seems to be close to our use case. I see three crucial differences. First, it runs on a VMWare platform with relatively more resources than our EC2 platform. Second, the exact scenarios are not described. When I studied the Spring Travel Application that was used, I noticed than none of the SQL queries generated contains joins. On the contrary, the application of our POC implements a lot of joins. And finally the benchmark only mentions a number of concurrent threads without details about think times and scenarios. As with a smaller number of threads (1780 threads for VMWare benchmark and 5250 concurrent threads in our case) their MySQL server is saturated, I assume that their think time is relatively small. Such benchmark is much more IO intensive with more simple queries.
To conclude, clearly identifying the performance bottleneck of the application with concrete measure is a key point before choosing a technology. Some real architectural advantage of NewSQL technologies can be completely hindered by a specific use case.
Many thanks the NewSQL team which has participated in the implementation of this Proof of Concept (in alphabetical Order): Nicolas Colomer, Nicolas Landier, Borémi Toch and Djamel Zouaoui.