SLO: The unexpected power of metrics
When operating a product or building an infrastructure, it is normal to ask yourself the question "Is my application working well?"
In general, it is common to have two answers in these kind of cases:
- Use monitoring to check if the application is working properly.
- Set up an alerting system to be aware of possible problems in the system
However, we rarely wonder if alarms are relevant in my specific context (ex: when a container restarts) or if the metrics on my pre-made dashboards will be useful to identify a dysfunction.
This article aims to introduce you to how Site Reliability Engineers or SREs (a term defined in Google’s Site Reliability Engineering series of books) approach their application metrics. We will see how they position factual objectives on those metrics in order to determine if the application really presents the expected quality of service and how they go beyond the simple visualization of it.
These principles will be highlighted by presenting Keptn, a young solution on the market which illustrates some of the possibilities opened up by this new way of doing things.
SLI,SLO,SLA...SLWhat ?!
The first questions we may ask to ourselves could be: Where to start? What are the symptoms of a malfunction in my app? How do I identify that my application is working correctly?
The SRE approach explains that it is impossible to run a service properly without understanding the behaviors that are important to the service. This requires an ability to measure and evaluate them. In the end, this is what will allow us to deliver a level of quality that meets the expectations of end users.
To do this, they define three concepts:
Service Level Indicators (SLIs), which are metrics that can be tracked. These can be application metrics, coming from the infrastructure or from external sources. The important thing is to choose indicators that correspond to the state of health of the application. One example of this could be the response time of a service, which can negatively impact the user experience.
Service Level Objectives (SLOs) represent objectives for specific SLIs and define a quality goal that a service has to satisfy. They are for team internal purposes and should not be exposed to the service user. Continuing the previous example, an SLO related to the response time of my page would be a response time of less than 2 seconds, 90% of the time. The SLO is the keystone of change management for Google's SREs. Exceeding it would be considered as an incident and long-term actions would be put in place to remedy it. To do this, we find the notion of Error Budget which will allow us to define a level of "flexibility to error" in order to finance operations unrelated to the product team. Still following the previous example, if my goal is to have less than 2 seconds of latency 90% of the time, my error budget will be 10% of the remaining time. It is important to also monitor how fast the budget is being consumed (Burn Rate), to ensure that necessary actions are triggered in case it is used up too quickly.
Finally, Service Level Agreements (SLAs) correspond to a contractual level of expectations with the service user. These are quite present today, especially with the rise of managed services offered by cloud providers. In general, the SLA is a contractual representation of an SLO (my service must be available n% of the time otherwise I am subject to penalties). However, given its contractual value and the “objective” nature of the SLO, it is recommended to set the SLA lower than the associated SLO.
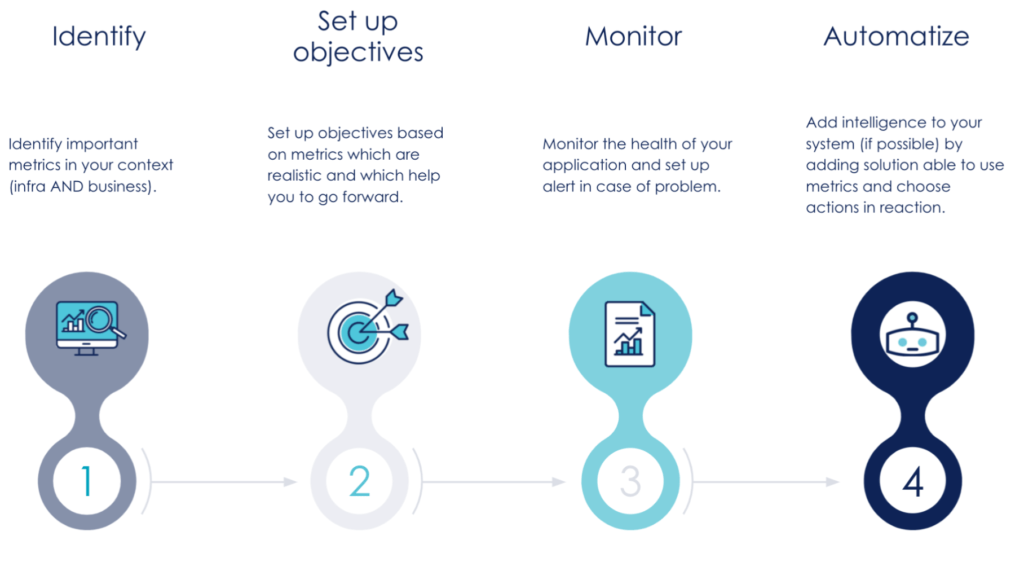
Define your priority
To correctly define the specific SLIs for an application, it is important to ask yourself what is important for you and the users who will consume the service. This means questions like: Is my service capable of responding to requests? How long does it take to respond? Is it responding correctly? For a storage system, questions like: can my system handle the IO load? Is it available on demand? For data management, we will be able to orient ourselves based on the freshness of the data, percentage of data covered by the data pipeline, or the correctness of the data pipeline, for example.
Those questions highlight specific metrics that can serve as an indicator. We can monitor them to check if the application is running correctly. Metrics are often centralized in a document built by/with the team and validated by the PO.
The art of retrieving metrics
Once the indicators have been identified, we want to retrieve them. To do this, there are several strategies:
- Integrate within the application with dedicated libraries such as Prometheus applicative clients which allow us to expose custom business metrics with the OpenMetric format
- Use an agent directly inside the services/applications which collect logs, metrics, context and traces. This approach is used when we use solutions like Dynatrace, Datadog or Sentry for example.
- Retrieve usage metrics using a brick positioned as a proxy in front of the application. This can be found with tools like services mesh (ex: Istio) or API Management solutions (ex: Kong plugin)
- Use the information exposed by the infrastructure or managed services
- Count application logs with an extension on the top of Elasticsearch
These metrics are usually stored in a Time Series Database (TSDB) like Prometheus (then exposed via a Grafana) or within all-in-one solutions from major market players such as Dynatrace, Datadog, AppDynamics or Splunk for example.
Define normality
Once metrics are in the system, we will be able to add to them a dash of observability magic: the transformation of the raw metric into an actionable metric that can serve as an SLO. To do this, we add thresholds on a metric group in order to define their limits. These levels are business-oriented and correspond to the level of quality expected by users. They must be defined in collaboration with product owners to have thresholds as close as possible to customer expectations.
eg: 99% of calls over 1 minute take less than 100ms.
Some good practices for choosing SLOs (based on the Site Reliability Engineering books):
- Think of goals as what they should be and not as they currently are
- Keep SLOs simple (1 SLO per 1 SLI)
- Less SLO you have, better it is
- Keep in mind that the system cannot “scale” indefinitely (even on the cloud)
- Improve gradually objective levels (you can raise progressively)
Now that we have introduced the notion of SLO, let's see how to use it.
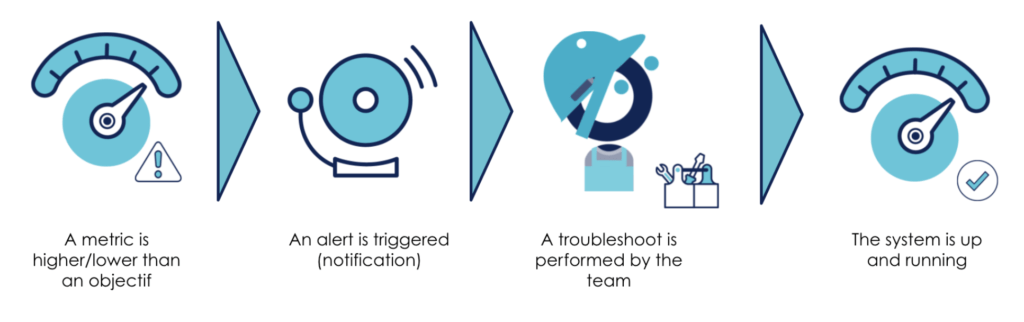
Behaviors and reactions with SLO
The most common usage with SLO and associated SLI is to highlight system behavior with an alerting system. When the metric goes beyond the defined threshold, an alert is raised and sends a notification (pager, channel), an email…

A tool which bring few memories to people who got it on their pockets
Once an alert is raised, an operator handles the problem with a few steps of troubleshooting and the associated remediation process as far as possible.
Until here, nothing unusual. However, let’s get out of our comfort zone and start to explore some of the other lesser known places.
To go further: Do better with less
Coming back to the Site Reliability Engineering book, we learn that Google engineers have the goal to reduce as much as possible the number of manual operations performed on the system. To do it, they try to make applications as autonomous as possible (the application should be able to run without any manual operation and it can fix itself without the help of an operator). It permits:
- to reduce the number of manual operations (and to save time)
- and to improve the focus on software engineering to facilitate the running of the application
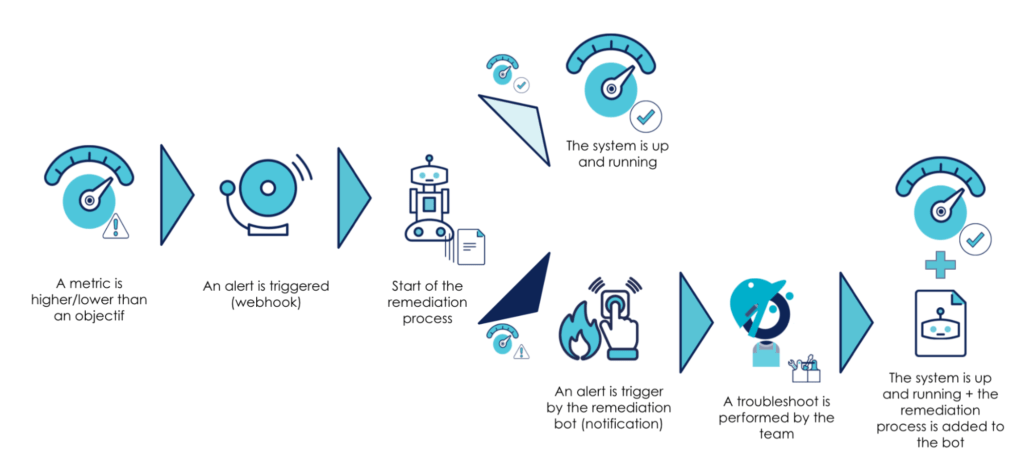
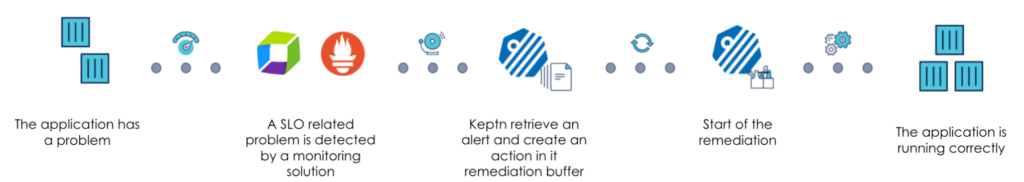
Thereby, one of the uses that we could imagine is the automation of the repair process (if it is possible) also known as self-remediation process. Let’s look at an example:
After a specific event, an SLO is exceeded. This triggers an alert that notifies an operator about the problem. Once analyzed, the team will take charge of the problem.
Going further, why not add a step that will analyze the alert and identify repair procedures based on it? If a procedure is not known, an engineer is notified and can take charge of setting up the automatic procedure after remediation. If the procedure is known, it will trigger an auto-remediation.
Currently, we can find this kind of process on basic infrastructure problematics:
- via auto-scaling rules based on resource consumption (CPU, memory…)
- through probes mechanisms (health / readiness checks) and their respective effects on the system
By adding business metrics, studying SLOs allows for the creation of new possibilities.
This pattern, which uses alerting from an external solution (Alertmanager, etc.), is one of three self-remediation patterns (with the operator pattern and internal detection). The other two will not be described in this article.
Another atypical usage we can find is that SLOs are used as additional gates on CI/CD pipelines. In addition to the traditional integration, performance or other tests, we will be able to automatically analyze the behaviors caused by the execution of these tests on the system. This allows us to identify, during a stimulation, if the application meets the pre-defined good operating conditions.
Currently, this usage already exists, but it depends on the interpretation of the person who reviews the testing report and pushes the next step button if all is fine.
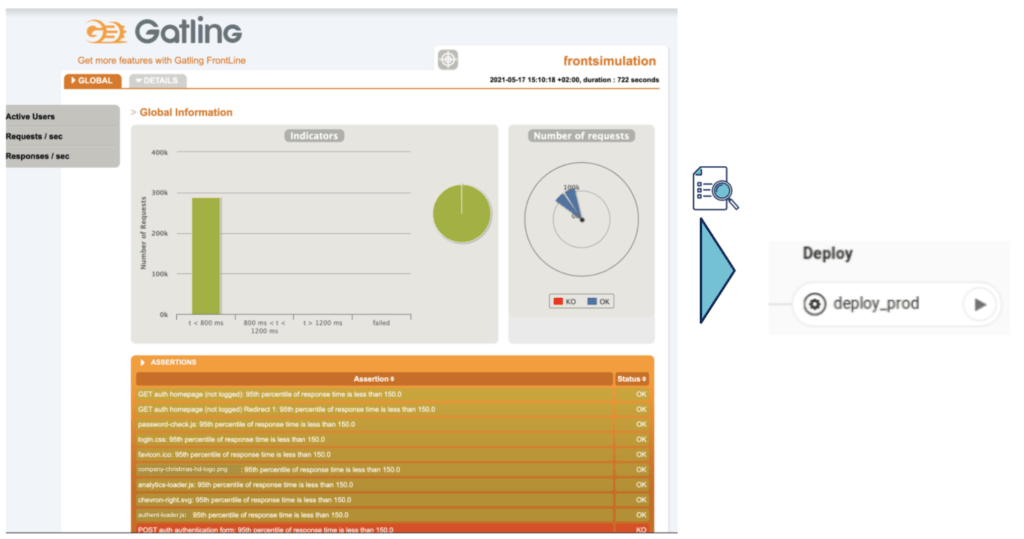
Why not automate this interpretation? After all, the environment where tests are run has a solution for monitoring metrics. It must be able to make the link between the test and the monitored metrics if these are important to us. By analyzing these metrics automatically, it becomes possible to automate this lock mechanism.
Spotlight on Keptn
![]()
To illustrate these concepts, I would like to introduce Keptn. A tool initially developed by the Dynatrace team and now a CNCF open-source project. Some of its capabilities are:
- implementing SLOs and SLIs
- orchestrating continuous delivery with quality-gates based on SLOs
- managing self-remediation procedures including SLO-based checks if remediation is successful
This is deployed on a Kubernetes cluster and can be interfaced with various components such as monitoring, performance tools...
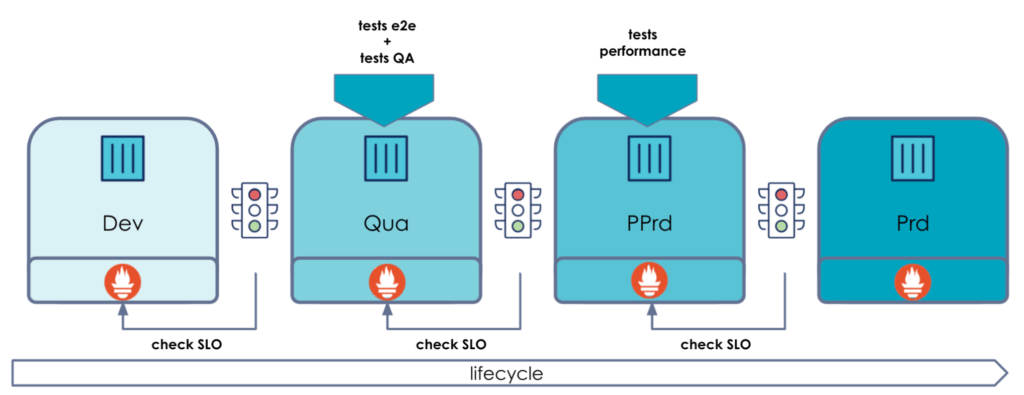
The objective of this tool is to support applications during all stages of their life cycle. During the development / promotion / run phase, it uses application metrics to set up SLO-based quality gates on environments in order to manage environment promotions or self-remediation on final environments.
It is possible to use only the quality-gates or self-healing part, but why should we not use the full potential of this tool?
Now let's take a tour to illustrate how this tool works. If you want to explore Keptn, you can find tutorials here. (the tutorial used on this article for SLO-based quality gates can be found here)
Illustration by practice: SLO-based Quality Gates
For this experiment, we used a GKE cluster with Istio and Prometheus installed on it (Keptn has support for multiple providers and in this example we are going to use Prometheus to retrieve SLIs).
The idea here is to deploy an application with a blue/green deployment on two environments (hardening and prod) and add a change on the app (which causes problems) to illustrate how the SLO-based quality gate works.
The first thing to do is to declare an application in Keptn to set up the deployment workflow and the steps associated with the validation. As with a lot of modern tools, it is declared as code (yaml is code).
The file has the following format:
--- apiVersion: "spec.keptn.sh/0.2.0" kind: "Shipyard" metadata: name: "shipyard-sockshop" spec: stages: - name: "hardening" #<- environment sequences: #<- steps - name: "delivery" tasks: - name: "deployment" #<- deployment strategy (blue) properties: deploymentstrategy: "blue_green_service" - name: "test" #<- tests to launch properties: teststrategy: "performance" - name: "evaluation" #<- SLO check - name: "release" #<- deployment (green) - name: "production" sequences: - name: "delivery" triggeredOn: - event: "hardening.delivery.finished" #<- promotion condition tasks: - name: "deployment" properties: deploymentstrategy: "blue_green_service" - name: "release"
When Keptn is attached to a project, it creates a kind of Gitflow in the Git repository which contains branches associated with our environments.
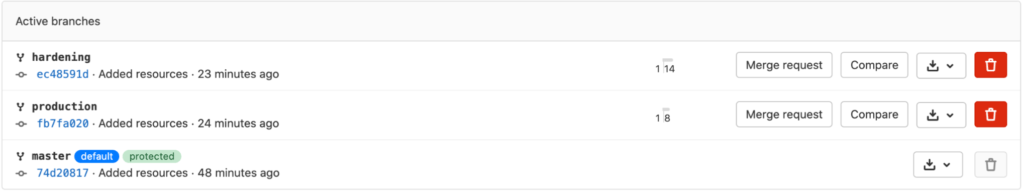
In each of our branches, we can manage tests, quality gates (SLOs) with associated SLI for each environment.
Once our environments are declared in our services, we will launch a first CD pipeline without tests.
It is to be noted that during the experimentation phase, we saw that our environment needed only one Kubernetes cluster because it uses the logical separation provided by Kubernetes’s namespaces. However, Keptn also offers multi-cluster support.
podtato-head/delivery/keptn main > kubectl get ns | grep pod-tato pod-tato-head-hardening Active 40m pod-tato-head-production Active 39m
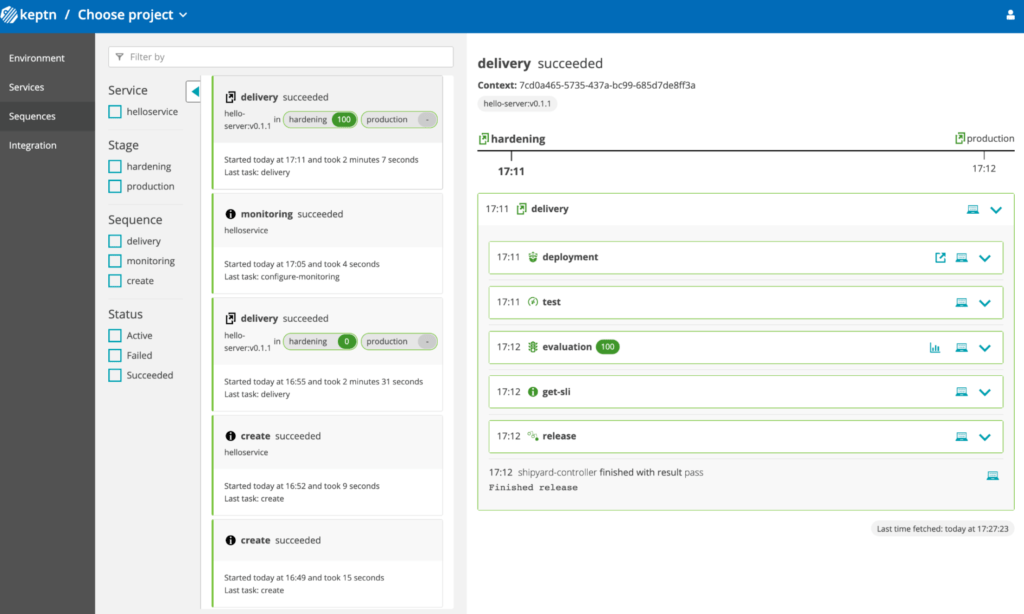
Once deployed, we can see that all tasks run following the order declared by the platform.
We have the possibility to add tests and an SLO check. For performance testing, we use the Jmeter because the solution has an associated plugin (the list can be found here and integrations in active development can be found here.)
We can make the link by adding the description of the strategy:
--- spec_version: '0.1.0' workloads: - teststrategy: performance vuser: 50 loopcount: 10 script: jmeter/load.jmx acceptederrorrate: 1.0
At last, we can define SLOs which permit to identify if an application’s behavior matches with our compliance criteria:
--- spec_version: '0.1.0' comparison: compare_with: "single_result" include_result_with_score: "pass" aggregate_function: avg objectives: #<- SLO definitions - sli: http_response_time_seconds_main_page_sum pass: - criteria: - "<=1" warning: - criteria: - "<=0.5" - sli: request_throughput pass: - criteria: - "<=+100%" - ">=-80%" - sli: go_routines pass: - criteria: - "<=100" total_score: pass: "90%" warning: "75%"
Let’s try to make a version upgrade with an image which does not answer to promotion criteria (with a high latency time...):
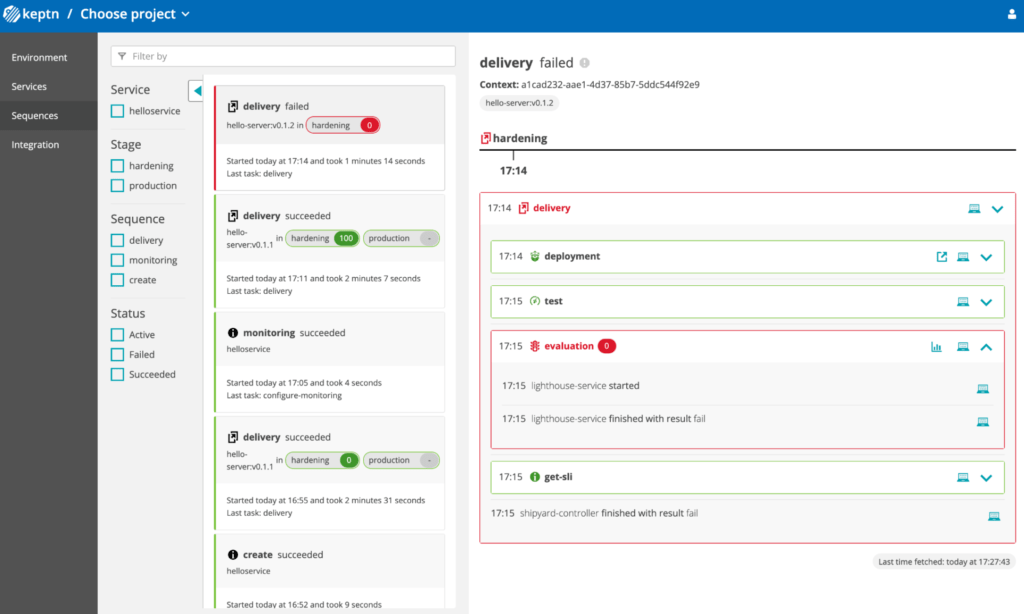
When we analyze the result, we can see that the quality-gates are blocking the progression on the new version of the image:

We can see that the deployment on the cluster is fully handled by Keptn and that it uses a blue/green deployment strategy:
podtato-head/delivery/keptn main > kubectl get pod -n pod-tato-head-hardening -o custom-columns=”NAME:.metadata.name,IMAGE:.spec.containers[0].image” NAME IMAGE helloservice-8966877c7-c8gs8 gabrieltanner/hello-server:v0.1.2 helloservice-primary-5f779966f9-5cgm7 gabrieltanner/hello-server:v0.1.1
Presentation of the self-remediation process
The self-remediation loop can be found in the Shipyard.yaml file, similar to the definition of the delivery sequences. It follows a list of steps which will be in charge of executing and checking the application’s behavior in the targeted environment (production, in this case).
--- apiVersion: "spec.keptn.sh/0.2.2" kind: "Shipyard" metadata: name: "shipyard-sockshop" spec: stages: - name: "production" sequences: - name: "remediation" #<- self remediation sequence triggeredOn: - event: "production.remediation.finished" selector: match: evaluation.result: "fail" tasks: - name: "get-action" - name: "action" - name: "evaluation" triggeredAfter: "10m" properties: timeframe: "10m"
Here, if an event is detected by Keptn, it is resolved during the remediation loop. The evaluation step will fail and set up remediation actions inside a buffer which will be retrieved during “get-action” and “action”. A new evaluation will be done to be sure that the problem is solved.
Remediation actions are based on this model:
--- apiVersion: spec.keptn.sh/0.1.4 kind: Remediation metadata: name: serviceName-remediation #<- Keptn service spec: remediations: - problemType: Response time degradation #<- title of the alert actionsOnOpen: #<- action list - action: scaling name: Scaling ReplicaSet by 1 description: Scaling the ReplicaSet of a Kubernetes Deployment by 1 value: "1"
At the end, Keptn adds in the interface a trace about the execution of the remediation process:
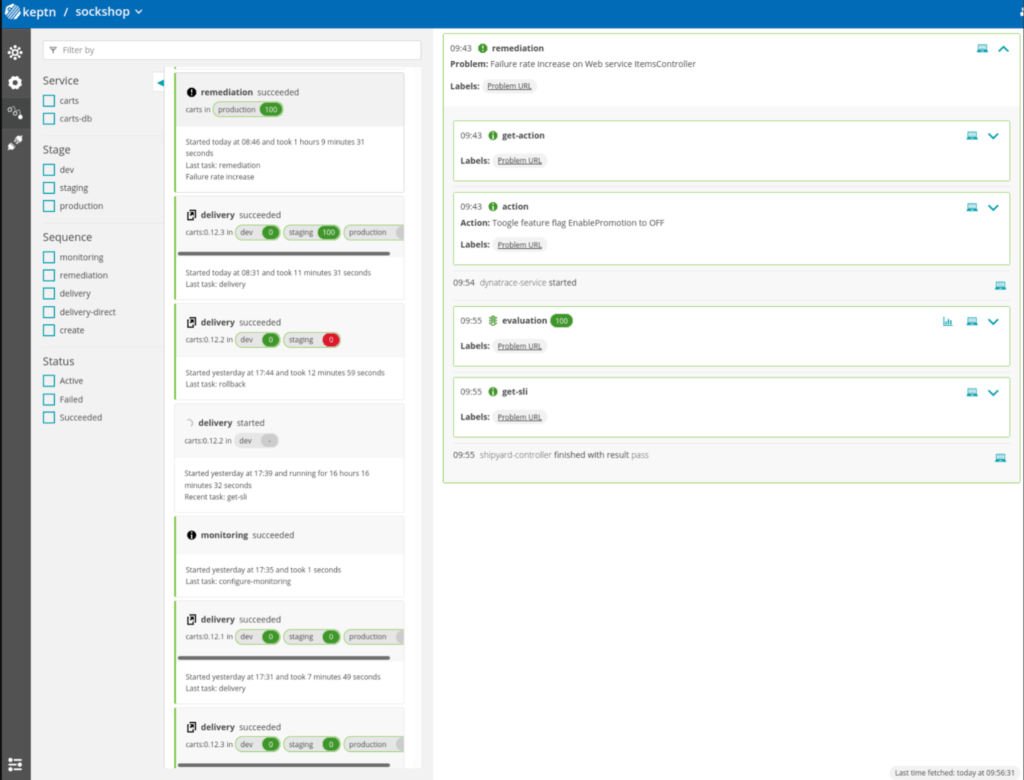
For the moment, we can find two actions by default (they are implemented with predefined ActionProviders):
- scale (increase/decrease the number of pods)
- featuretoogle (enable/disable specific flags)
Those actions can be extended by adding our own ActionProviders.
Just a last word
As you have seen in this article, metrics are often underestimated because in the “collective unconscious”, they are used for dashboards and alerts only. However, when we start to define goals and programmatically find a way to exploit them, our best-practices are multiplied tenfold. This opens the door to many subjects and methodologies: SRE practices, chaos engineering and all subjects based on the principle of “a good factual and measurable run”.
You have to keep in mind that Keptn is one tool among many others and I think that in the future, a very large number of tools of this type will appear in our landscape in order to change our relationship with the OPS jobs and practices.
To sum it all up: