Measuring Web Application Performance – 2/3
In the first article, we saw why performance test strategy is so important in order to ensure the proper functioning of a web application and how it can affect your business.
No more pain, in this second article I will show you the steps to plan and execute your performance test.
Imagine that after a marketing campaign, your e-commerce website is getting a peak of visitors and unfortunately instead of increasing, sales are actually going down drastically. How is this possible? If I am getting more visitors, why am I making less money?
It's quite easy to understand actually: with peaks of hits the website probably suffers from outages, timeouts and consequently, may be down during visits. London Olympics 2012 is an excellent example of such situation: the official site took almost 1 minute to complete any shipment. Unfortunalty most of customers were not satisfied and preferred to leave the web site.
To avoid being trapped in a similar situation you have to know how much your application can take so that you can adopt many solutions to face a peak of visitors. Only performance testing will tell you about the robustness of your web site.
Plan a performance test in 8 steps
Identify the execution environment
The first requirement for a reliable performance test is to have a dedicated environment: you can either use an isolated environment like an internal network, without external access to the internet, or the own production environment.
Yes, it sounds crazy, but it's common to see performance test in the production environment. You can consider it as the ultimate test.
Identify the criteria for acceptable performance
A baseline must be defined so that you can distinguish between a slow and a fast response time. There are three important time limits to know:
0.1 second is about the limit for having the user feel that the system is reacting instantaneously, meaning that no special feedback is necessary except to display the result.
1.0 second is about the limit for the user's flow of thought to stay uninterrupted, even though the user will notice the delay. Normally, no special feedback is necessary during delays of more than 0.1 but less than 1.0 second, but the user does lose the feeling of operating directly on the data.
10 seconds is about the limit for keeping the user's attention focused on the dialogue. For longer delays, users will want to perform other tasks while waiting for the computer to finish, so they should be given feedback indicating when the computer expects to be done. Feedback during the delay is especially important if the response time is likely to be highly variable, since users will then not know what to expect.
Basically you should never be over 1 second.
Identify test scenarios
You have to be aware of the current status of the application in term of volume of current users and in a more global way volume of data. If your website is visited by 10 concurrent users there no need to build a scenario with concurrent 1000 users. Also your test scenario must replay the real case scenario from end to end: for example, if we're talking about a virtual store, then the scenario should consider the user connection then products selection and the check out. You can also choose to target only the most critical scenarios in a technical or business point of view. The performance test you build must be realistic.
Also remmember that only results from identical test executions, with exact same data can be used to identify a change in performance. It will make no sens to compare results from sessions using different databases.
Identify the test load levels
This just means that you have to define how many concurrent users you want and the ramp up period.
It can be 10, 1000 or 1 million users as long as it is representative of the actual traffic of your web site.
Choose your performance toolbelt
There are dozens of tools that can run load tests. Each of them have its own particularity.
For instance one tool can focus on reporting when an other one will be more efficicient for generating very high traffic. Also some tools will offer you a wide range of functionnality - not sure you will always need all of them.
Build your tests
Usually test scenarios consist in one XML file that declares the URLs to fire, user credentials and any other needed data.
You can automatically generate these files using the testing tool you choose: for instance JMeter uses a proxy to watch the URL you are browsing and then copy it into an XML file to be used as input for the test load.
However in some cases you will have to work a bit more to make you test work: for instance ASP.NET WebForms applications generate a dynamic value called the VIEWSTATE. This value is set inside each page within an input field.
Depending on the tool you choose you have different ways to deal with this situation. With JMeter using regular expressions to parse the HTML output and send back the VIEWSTATE value will do the job.
Run the tests
Last check before runing your test: make sure your database and application cache are cleaned.
Once your environment and configuration are ready just run it !
Report Analysis
Well, for me the success of the whole operation depends on this crucial part - what is a report good for if you can not understand it?
A misunderstand of the collected statistics will for sure take you away from the real problem cause. The two main statistics are response time and error rate.
You should always consider these rules when it comes to read your report:
There is something wrong with your environment if more than 20 percent of the test execution results appear not to be similar to the rest
Focus on the 95th percentile not the average
Pay attention to error rate, it indicates the maximum users your application can serve correctly
Don't hesitate to use additional tool for a deeper analysis of the report, BlazeMeter is a good one.
What are the criteria for choosing the proper tool?
You should focus on four criteria to correctly choose the tool that fits your needs:
- Project requirements
- is your application a desktop or web one ? What protocols are you using ?
- Price
- An expensive tool will not necessarily satisfy your expectation
- Integration with other tools
- it can be very interesting for advanced analysis and a wider vision of your system
- some tools supports plugins input
- Report's quality
- Usually comes in two flavors: text and graphical. The visual representation is a real plus to understand the report think about it.
Available Tools
There are three type of tools when it comes to load testing:
- Load testing from Desktop
- Load testing SaaS
- Resource monitoring tools
| Desktop Load | SaaS Load | Resource monitoring tools (hardware) |
| Apache JMeter Bees with Machine Guns Gatling HttpPerf LoadImpact LoadRunner Loadster Loadstorm LoadUI MultiMechanize NeoLoad OpenSTA QEngine (ManageEngine) Rational Performance Tester Siege Testing Anywhere WAPT WebLOAD | Apica Load Test Blazemeter Blitz.io CloudTest Soasta | AppDynamics NewRelic |
Our selection
For a complete and efficient test we choose three tools to use together:
| Test creation and execution | In the cloud distributed test loading | Performance analysis and counters |
 |  |  |
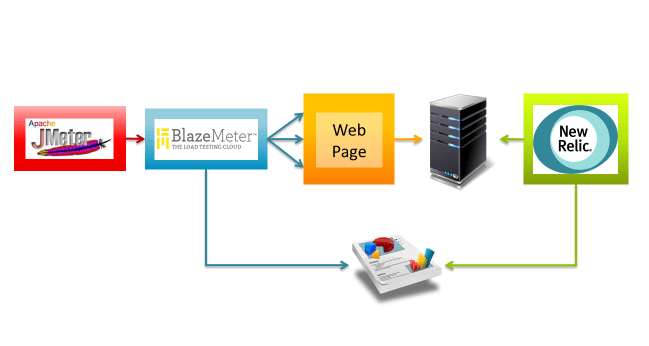
JMeter is the most widely used tool for creating and executing load testing scripts in the opensource world. Whereas the scenarios will be created in the JMeter, the best choice in terms of integration and execution of these scripts in the cloud is without a doubt the BlazeMeter, which in turn, in addition to rich reports in detail even offers integration with New Relic, which as a "detective" will be responsible for the monitoring of data and application servers, increasing the graphs and reports with data from the server hardware utilization.
BlazeMeter is a web application, paid on-demand, which provides a simple integration with JMeter load testing script, simulating thousands of users visiting a Web site using Amazon Elastic Compute Cloud (EC2) as a service for the execution of tests.
NewRelic is a SaaS solution that allows you to monitor Web applications. The idea is pretty simple, there is an agent that collects performance data and sends it asynchronously to a server of New Relic, displaying a kind of x-ray its application, with information of CPU, memory, response time, throughtput, number of requests, errors, slow transactions, database usage, JVM in real time.
Thus, we have three tools that integrate to provide a complete insight of the load tests results.
Isn't JMeter enough?
We have seen that we can use JMeter to create, execute, and analyze the results, then, why use another tool in the cloud to perform and analyze the results, if we could make the tests from a simple desktop?
Simple, imagine that you are testing a virtual Grand Lodge, surely it will have defense mechanisms ante-hacker or some kind of defense against DDoS ATTACK "attacks", which means that when your test via JMeter start, you'll be using the same IP to perform the requests to the server, and logically will be easily recognized and blocked by the tools of protection
However when using a load testing tool in the cloud, it instantiates several machines (that create other virtual machines) which in turn perform http requests to the specified address. Making a simple analogy, using a load test tool desktop, you'll be a soldier in the middle of a battle, with a machine gun, shooting at your target, if it is located, will be neutralized. While using a load testing tool in the cloud, you command an army of machine guns, all scattered in various places, firing in a same location.
Conclusion
Despite a focus on speed to be an ancient practice of the giants of the internet, companies begin to notice that their customers want on top of navigation performance, however the relationship between amount of users and response time is exponential, that is sometimes, after a point, the more users its application has, the longer it will take to load, thus creating new challenges for those who want to become big on the web.
A good strategy to stay one step ahead, is to use performance testing techniques in order to discover the application behavior during a peak usage, plus discover bottlenecks and, obviously, the access limit.
Who wants to be big on the internet, should prioritize the performance testing. After all, time is money, and with so many options available no one else is willing to lose time.
Perform load testing often allows you to track the evolution of application every release, and measure whether performance regression between alleged improvements on the site. But that's a subject for next post =)