iOS dev: How to setup quality metrics on your Jenkins job?
iOS development projects are not first-in-class when it comes to managing the quality of the software produced.
Very short projects, very short time-to-market, it is not the kind of projects where you see a lot of attention towards quality, unfortunately.
Here at OCTO we try to do it differently, even for this kind of projects. Or above all, for that matter. But here comes another issue: the lack of tooling.
Here is one of our latest attempt to setup quality metrics on a short and budget constrained iOS project. And yes, a teaser, look at our dashboard at the end of this six weeks (six Agile iterations) project:
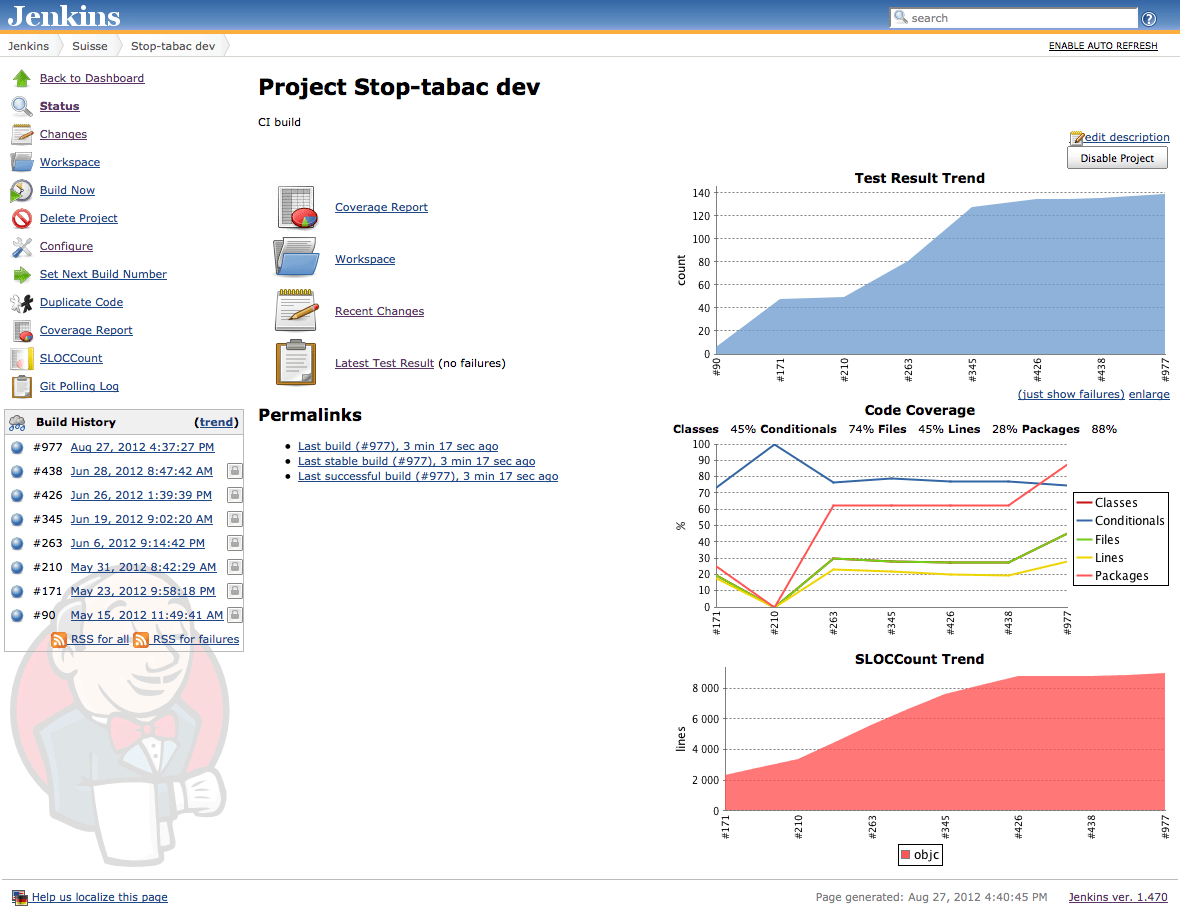
The following article will detail how to setup all these quality metrics in a integrated report in Jenkins (Continuous Integration).
Here is the breakdown of this article:
- Tooling overview
- Step 0: Setting-up Jenkins
- Step 0bis: Setting-up your Jenkins job
- Step 1: Setting-up easy metrics
- Step 2: Setting up harder metrics
- Step 3: Enjoy!
- Conclusion
Tooling overview
When it comes to tooling, Objective-C is a mixed case because it is at the same time a proprietary platform and a language derived from C. In practice, here is the current situation on quality tools for Objective-C:
- there is not much static analysis tools (ok there is Clang Static Analyzer but mostly for memory management, far less useful since the introduction of ARC for iOS). You could use clang AST to write your own checks for your project or company but I haven't yet heard of anybody having done this. No FindBugs, PMD or Checkstyle for Objective-C yet. In fact by saying this I thought I'd better double check and I found OCLint that looks interesting but is in a very early stage.
- even basic code metrics are not easy to compute. Most of the C tools for calculating LOCs work (for example SLOCCount or cloc) but you can't get interesting metrics like number of classes, class complexity, method complexity etc.
- one of my preferred quality metric, code duplication, is feasible but not that easy. You can use PMD. for this (with a specific grammar) or use Simian (that supports it out-of-the-box but is not free for commercial use)
- code coverage is feasible but not easy to get it right. You can do it thanks to a gcc feature called GCOV.
- there is no way to aggregate, consolidate and track all these quality metrics. No Sonar for iOS, said differently (or not yet, see the end of the article (LINK)). To fill in the gap, we have used directly our build server (Jenkins) to act both as the dashboard and the history of these metrics.
Let's look at how to setup all those metrics.
Note: If you get lost on the way, do not hesitate to check the end of the article, I have put links to sample configuration files
Step 0: Setting-up Jenkins
We will not detail this point as there are a lot of posts around on doing this. For example you can go with this one in case Jenkins is not already installed at your place. I recommend using the same user as your CI user because otherwise you will run into issues with Keychain certificates (the certificates you will install on your server will not be available to the Jenkins user).
Step 0bis: Setting-up your Jenkins job
As above, I refer you to this article if it is something new for you. I also recommend using the Xcode plugin for Jenkins.
Step 1: Setting-up easy metrics
Let's dive in interesting things. Setting up code metrics and code duplication is quite easy, so let's start with it.
Code metrics (LOC)
I decided to go for SLOCCount as it already provides a Jenkins plugin. The documentation for it is here.
I followed the instructions on both the SLOCCount page and Jenkins plugin page, that is basically:
- download latest archive of SLOCCount, unzip it somewhere, run 'make install'. It will install sloccount in /usr/local/bin.
- install the slocount plugin in your Jenkins (via Jenkins UI)
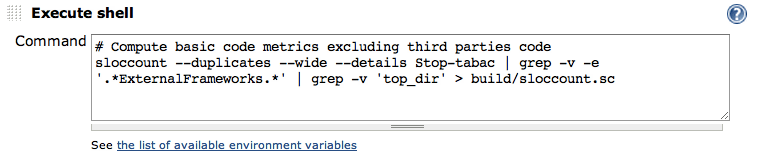
- add a Shell Build Step in your Jenkins job to compute the code metrics. This is the step I added in my job:
sloccount --duplicates --wide --details YOUR-PROJECT-ROOT-DIRECTORY | grep -v -e '.*ExternalFrameworks.*' | grep -v 'top_dir' > build/sloccount.scThis is how it looks in my Jenkins job configuration: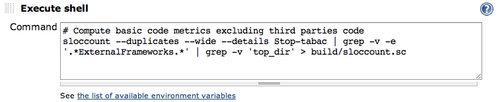
- I excluded third-party source code with "grep -v -e '.*ExternalFrameworks.*'"
- I avoid an issue with SLOCCount plugin (see here) with "grep -v 'top_dir'". This issue has been fixed meanwhile so this step might not be necessary any more
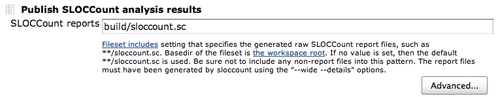
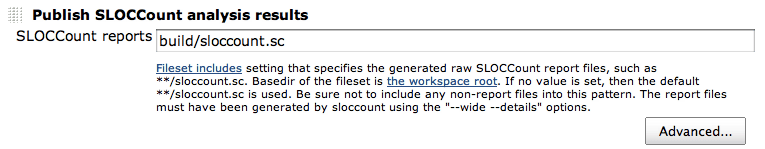
- Tell SLOCCount plugin where to find the report by filling the 'Publish SLOCCount analysis result' field with 'build/sloccount.sc' (see below)
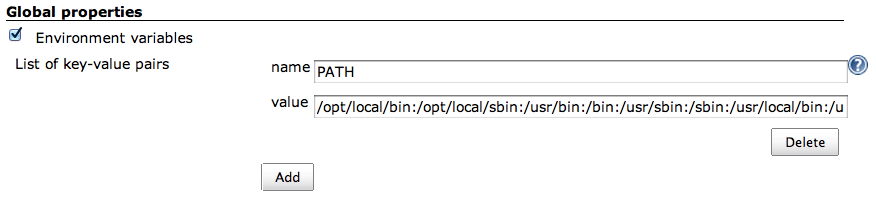
Once this done, relaunch your build. You might have to modify your Jenkins configuration to have /usr/local/bin in Jenkins path (unfortunately Jenkins do not use your system path). I fixed this by setting the PATH variable in Jenkins configuration with the content of my path ('echo $PATH'). You can do this in the 'Global properties' section of the configuration (not in your job configuration but in Jenkins configuration):
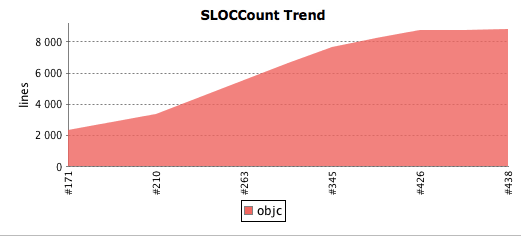
If you go back on your dashboard, you should see the trend graph on it and have also access to the full report through the left menu. Actually, depending on the plugins, the trend graph does not appear from the start but once it has enough data to display (typically after 3 or 5 builds).
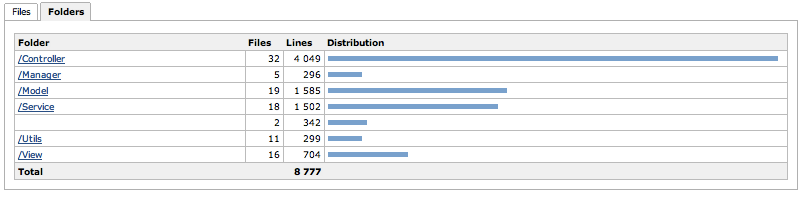
The detailed report gives you the details of LOC by file and by folder. You can do a first sanity check here to know if no file has been forgotten or is present by mistake. Here is an example of the report by folder:
Code duplication
The tool chosen here is PMD because it is free to use. In fact the Objective-C support is more 'beta' than it is in Simian, so you might choose the later.
Objective-C support in PMD is made possible thanks to Joshua Kennedy. Announcements and details on how to setup it are posted on his blog so I refer you to his post.
Basically you have to:
- download PMD and unzip it somewhere (I went for ~/PMD so the extracted path is ~/PMD/pmd-4.2.5)
- download the Objective-C grammar JAR and save it at the same place (~/PMD in my case)
- install Jenkins DRY plugin (via Jenkins UI)
- Add a Shell Build Step in your job and paste the following command:
java -Xmx512m -classpath /Users/udd/PMD/pmd-4.2.5/lib/pmd-4.2.5.jar:/Users/udd/PMD/ObjCLanguage-0.0.6-SNAPSHOT.jar net.sourceforge.pmd.cpd.CPD --minimum-tokens 100 --language ObjectiveC --encoding UTF-8 --format net.sourceforge.pmd.cpd.XMLRenderer --files YOUR-PROJECT-ROOT-DIRECTORY --files YOUR-TEST-ROOT-DIRECTORY > build/cpd-output.xmlThis is how it looks in my Jenkins job configuration: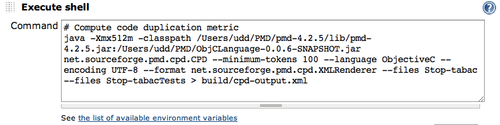
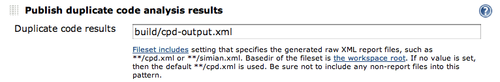
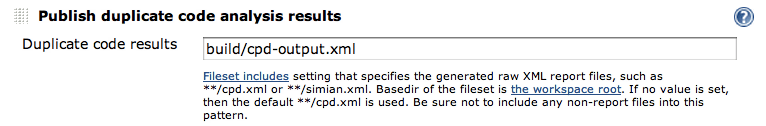
- Configure DRY plugin to use the CPD output. For this you have to fill the field 'Publish duplicate code analysis results' with 'build/cpd-output.xml'

Just one comment: I had trouble to make it work and always get a blank report file first (so as few other if you read the comments).
<?xml version="1.0" encoding="MacRoman"?>
<pmd-cpd>
</pmd-cpd>
If your are in this case, here is the hint: you have to specify a full path for the JARs in the classpath, for some reason I ignore.
Well, if things went right, you should now have on your dashboard a nice trend graph like the following:
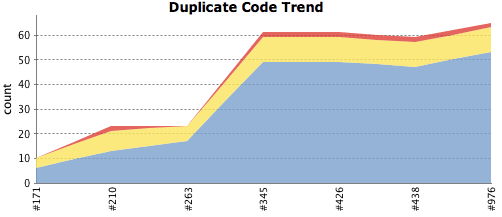
and you can access from the left menu the detailed report, including the report by file which is quite interesting:
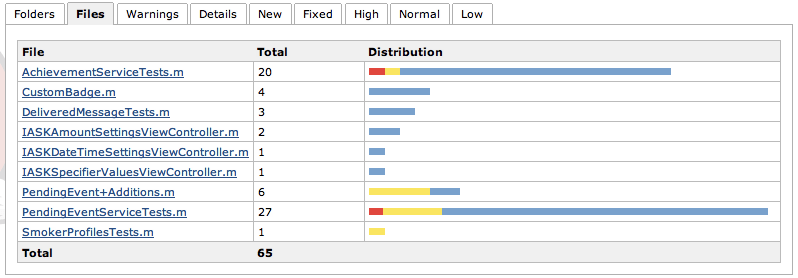
and if you drill down to the duplication, the detail of each duplication per file:
Nice, isn't it?
Step 2: Setting up harder metrics - that's where it hurts!
Let's step to the harder part, getting test results and code coverage metrics in Jenkins. Getting test results is pretty easy thanks to the Xcode Jenkins plugin though, because the plugin will take care to generate the test results XML file in the expected JUnit format.
Test results
To achieve it, you need to, basically:
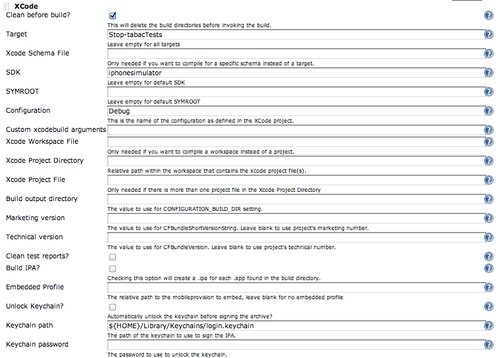
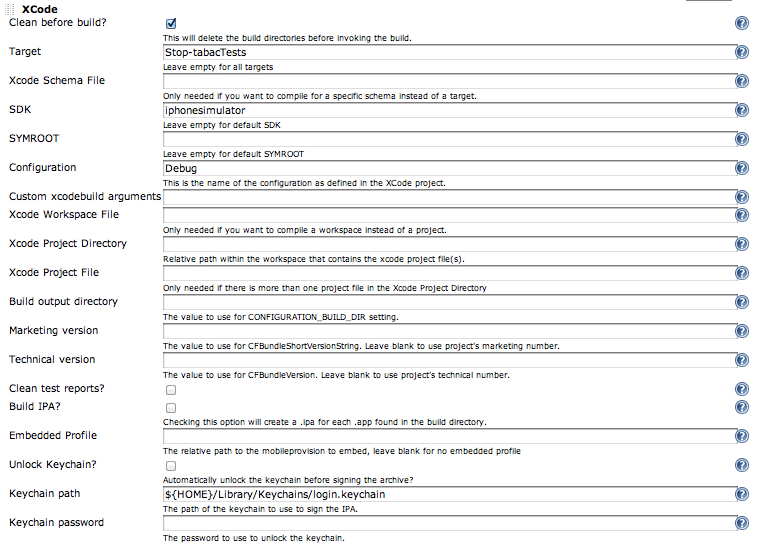
- Add a Xcode Build Step to your job. This one should compile your test target. I recommend compiling in Debug for the simulator because this will be useful when we will want to add code coverage results. In our case, see the step configuration below:
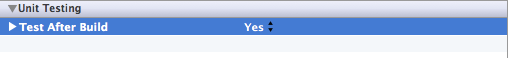
- enable the build setting 'Test after build' in your test target of your project in Xcode. Otherwise your tests will not be launched on the CI server. Notice that this will cause an ugly warning on the computer on which you develop when you run the tests (⌘ + u)

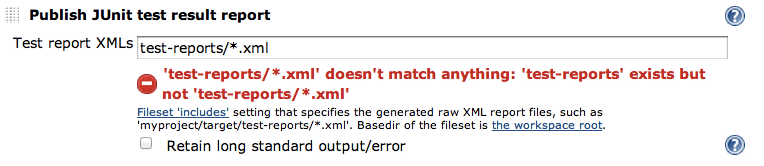
- Configure Jenkins to publish the report. For this you have to fill the field 'Publish JUnit test result report' with the value 'test-reports/*.xml', as shown below:

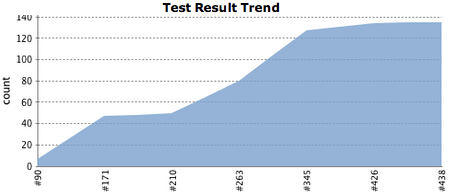
Once done, if you run your build again, you will get a new trend graph on your dashboard:
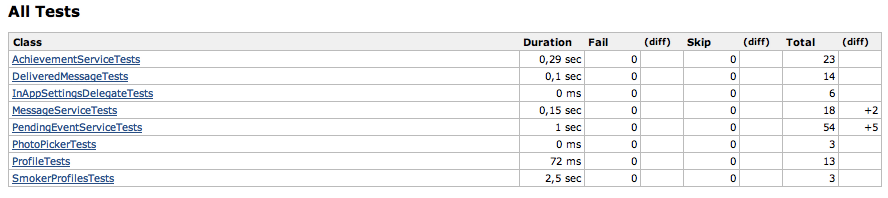
And you will be able to drill down to the individual tests or failures, in case there are some.
Alternative: Test results with GHUnit
Some of you might be using GHUnit instead of OCUnit (Xcode default).
Here is a summary of the differences:
- you do not need to enable the build setting 'Test after build' in your test target of your project in Xcode
- make sure that you have followed GHUnit documentation on command line usage. You should have added a script file RunTests.sh and a Run script Build Phase in your test target to launch the script. Notice that I didn't use the latest version of the script since I had an issue when running in Jenkins. I used this older one. For reference, see this discussion on Google Groups
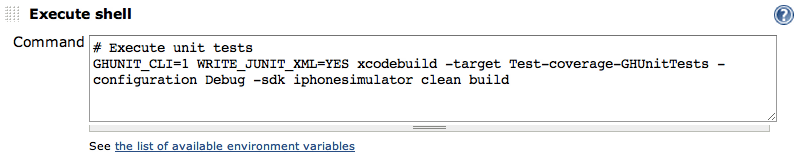
- you should not add a Xcode Build Step to run the tests but rather a Shell Build Step in your Jenkins job configuration. The shell code to run is the following:
GHUNIT_CLI=1 WRITE_JUNIT_XML=YES xcodebuild -target YOUR-TEST-TARGET-NAME -configuration Debug -sdk iphonesimulator clean buildThis is how it looks in my Jenkins job configuration: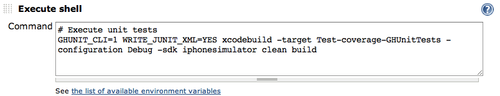
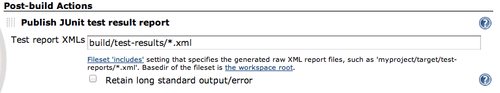
- The right path to the generated XML file for GHUnit is 'build/test-results/*.xml', as shown below:

Test coverage
Take a breath now (or a coffee), this is the harder part. There is a few good posts around on how to compute code coverage for iOS, but not always up-to-date The way to do it has changed drastically with the different versions of Xcode. The following has been tested with Xcode 4.3.3.
To summarize, you should:
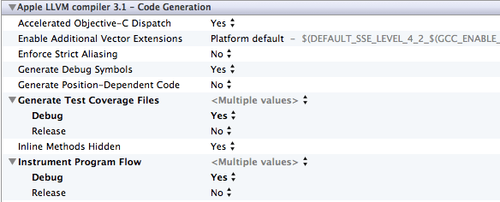
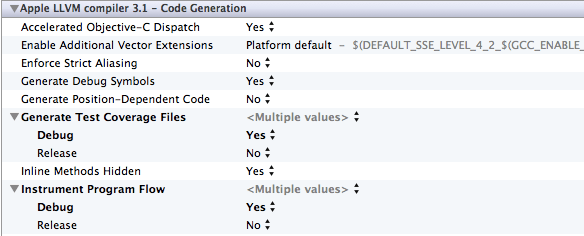
enable the two build settings 'Generate Test Coverage Files' and 'Instrument Program Flow' in the test target of your project in Xcode
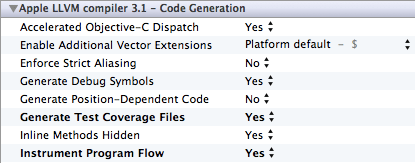
enable the two build settings 'Generate Test Coverage Files' and 'Instrument Program Flow' in the main target of your project in Xcode, but only for Debug
add code for missing fopen$UNIX2003 and fwrite$UNIX2003 functions. This is more an Xcode bug. I added this code in my AppDelegate.h:
#ifdef DEBUG
    FILE *fopen$UNIX2003(const char *filename, const char *mode);
    size_t fwrite$UNIX2003(const void *ptr, size_t size, size_t nitems, FILE *stream);
#endif
and this one in my AppDelegate.m:
#ifdef DEBUG
FILE *fopen$UNIX2003(const char *filename, const char *mode) {
    return fopen(filename, mode);
}

size_t fwrite$UNIX2003(const void *ptr, size_t size, size_t nitems, FILE *stream) {
    return fwrite(ptr, size, nitems, stream);
}
#endif
Once done, I recommend to check everything is working locally first. For that you should run your tests and go to: ~/Library/Developer/Xcode/DerivedData/YOUR-PROJECT-NAME/Build/Intermediates/YOUR-TEST-TARGET-NAME.build/Objects-normal/i386' and ~/Library/Developer/Xcode/DerivedData/YOUR-PROJECT-NAME/Build/Intermediates/YOUR-MAIN-TARGET-NAME.build/Objects-normal/i386'Both locations should contain several .gcno files if the project is properly setup and some .gcda files if your tests did generate coverage data. You can check that the coverage is correct by opening one of the files with CoverStory, a GUI for analyzing the coverage data.
Once your project properly set up, you have to configure Jenkins to generate this report automatically. This is explained in this blog post.
Basically you need to:
- download GCOVR, a Python script that will be used to convert the coverage files to a Corbertura XML format that is understood by Jenkins. Copy it at a safe place in your server (I put it in my repo in scripts/ directory).
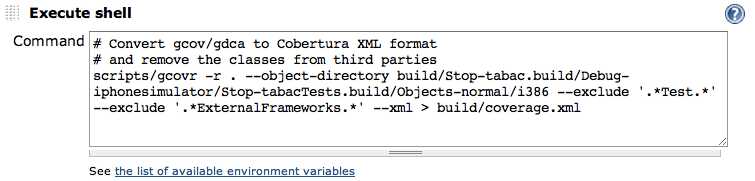
- add a Shell Build Step to your Jenkins job with the following content:
scripts/gcovr -r . --object-directory build/YOUR-PROJECT-NAME.build/Debug-iphonesimulator/YOUR-MAIN-TARGET-NAME.build/Objects-normal/i386 --exclude '.*Tests.*' --exclude '.*ExternalFrameworks.*' --xml > build/coverage.xmlThis is how it looks in my Jenkins job configuration: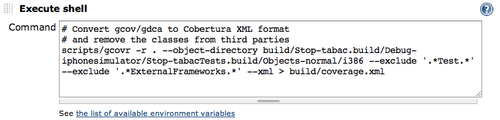
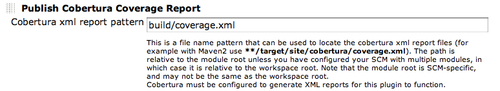
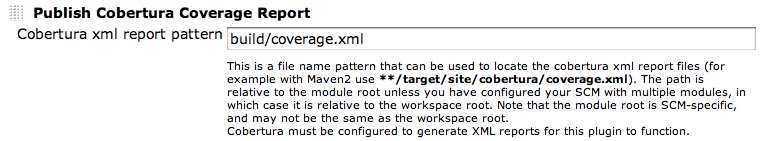
- install Cobertura plugin for Jenkins (using Jenkins UI)
- Configure Cobertura plugin to use the right output file. For this you have to fill the field 'Publish Cobertura Coverage Report' with 'build/coverage.xml'
Launch your Jenkins job! It works? Congratulations, but don't worry if it doesn't, this part is a bit a makeshift job, it might need some trial-and-error.
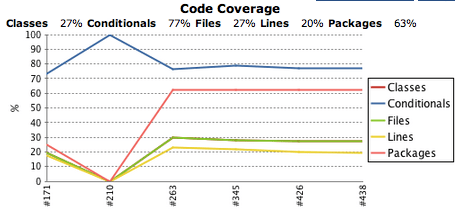
Once done, you will get a new trend graph on your dashboard as below:
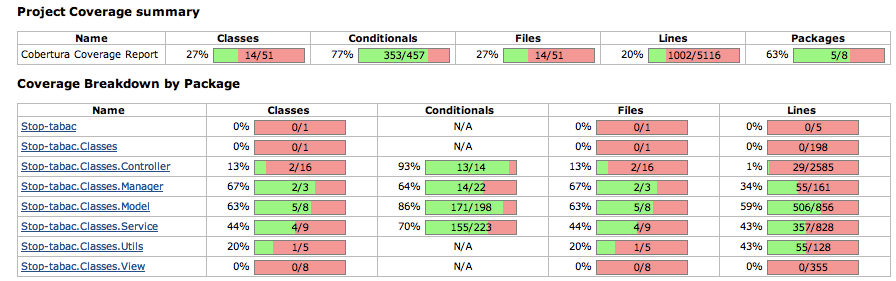
and you will be able to drill down to see the coverage of all your different files:
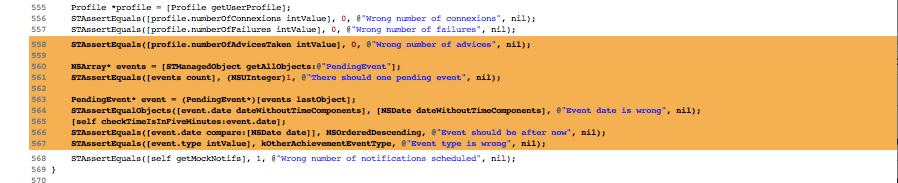
and event of the specific lines of your source code:
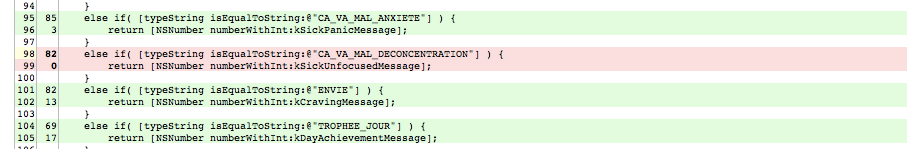
Satisfied? If you try this step, you will notice that you don't really get the same dashboard as the one shown above, right? In fact there is plenty to say about getting an useful code coverage measurement, and as this article was already long enough, I have detailed this in another blog article with all the tips and tricks that lead me here.
Alternative: Test coverage with GHUnit
For adding code coverage, the main differences with OCUnit (Xcode standard) are:
add the code for fopen$UNIX2003 and fwrite$UNIX2003 functions in the main.m file of your test target, not in the AppDelegate. This is how my main.m file looks like:
#import <UIKit/UIKit.h>

int main(int argc, char *argv[])
{
    @autoreleasepool {
        return UIApplicationMain(argc, argv, nil, @"GHUnitIOSAppDelegate");
    }
}

FILE *fopen$UNIX2003(const char *filename, const char *mode) {
    return fopen(filename, mode);
}

size_t fwrite$UNIX2003(const void *ptr, size_t size, size_t nitems, FILE *stream) {
    return fwrite(ptr, size, nitems, stream);
}
edit your test target .plist and add the property 'Application does not run in background' with value 'YES'. This is depicted below. Notice that this is useful because the coverage files are only written when the application exits.

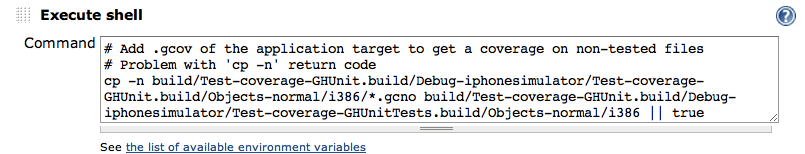
add a Shell Build Step in your Jenkins job configuration between the launch of your unit tests and the launch of the GCOVR script, with the following content:
cp -n build/YOUR-PROJECT-NAME.build/Debug-iphonesimulator/YOUR-MAIN-TARGET-NAME.build/Objects-normal/i386/*.gcno build/YOUR-PROJECT-NAME.build/Debug-iphonesimulator/YOUR-TEST-TARGET-NAME.build/Objects-normal/i386 || trueThis is how it looks in my Jenkins job configuration: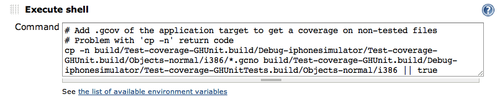
Step 3: Enjoy!
Congratulations!
But don't forget that all of this is only useful if you analyze it and track it regularly. This is what the trends are made for, and this is how I use these metrics:
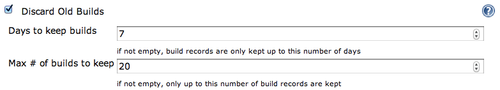
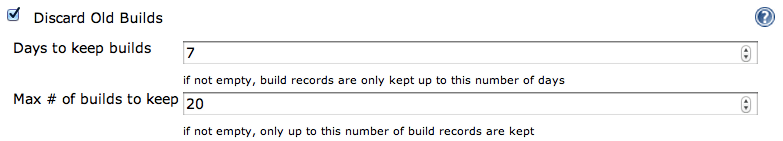
I manually mark important builds as 'Keep forever' in Jenkins and I enabled 'Discard Old Builds' in my Jenkins job configuration. In practice I only keep builds delivered at the end of each Agile iteration, to have a good vision of the coarse-grained variations (trends)
This is why all the graphs shown in this article looks so nice and clearly outline trends.
I review them at the end of each iteration to add actions to the backlog of the next iteration. Example of such actions:
- 'the code duplication has gone red, we will fix all red during the next iteration'
- 'The service layer is no more tested at a 80% test coverage, add tests on XXX and YYY in the next iteration'
- etc.
Conclusion
Honestly this is still a bit long/clumsy to setup, I think for a first installation it will take you about 2-4h. A lot more if you also need to install Jenkins and don't know Jenkins yet.
The good news is that once done for a first project, it's about 30 min of work for all the future mobile projects you will work on. I think this is acceptable even for very short projects.
I have an another good news for those that gave up because of time/pitfalls, we are currently working on a Sonar plugin for Objective-C. This will make all this easier and will bring new metrics. Stay tuned, we will announce it here as soon as we release the first useful version.
Last thing: I have put here the full configuration of my Jenkins job in case you want to compare with yours. I have also put a sample configuration for test and coverage for OCUnit and the same sample configuration for GHUnit, because this is the hardest part and I thought it deserves it.
And yes, I welcome your feedback if I forgot some steps or you think I should clarify a particular step.