Introducing Concept Drifts
In this article, we will introduce the notion of concept drifts: how to define and detect them.
Congratulations, you have been accepted as part of the Data Science team of an airline company! You were hired to build a Machine Learning model which predicts the company’s monthly profits.
After several weeks of experimentations on your Jupyter Notebook, your first model is launched into production. It has very good performance and KPI metrics.
However, several months later, you start to spot a drop in performance: your model is not as accurate in predicting the monthly profits as before.
You are now asked to investigate what happened and fix the problem…
In this article, we will only focus on the first part : understanding what could have caused a drop in performance related to a concept drift. Fixing the problem and identifying the root causes will be left for another article.
Where do I start?
A very similar scenario may have happened to you or your team. The first thing to understand is that a drop in the model performance is only the tip of the iceberg.
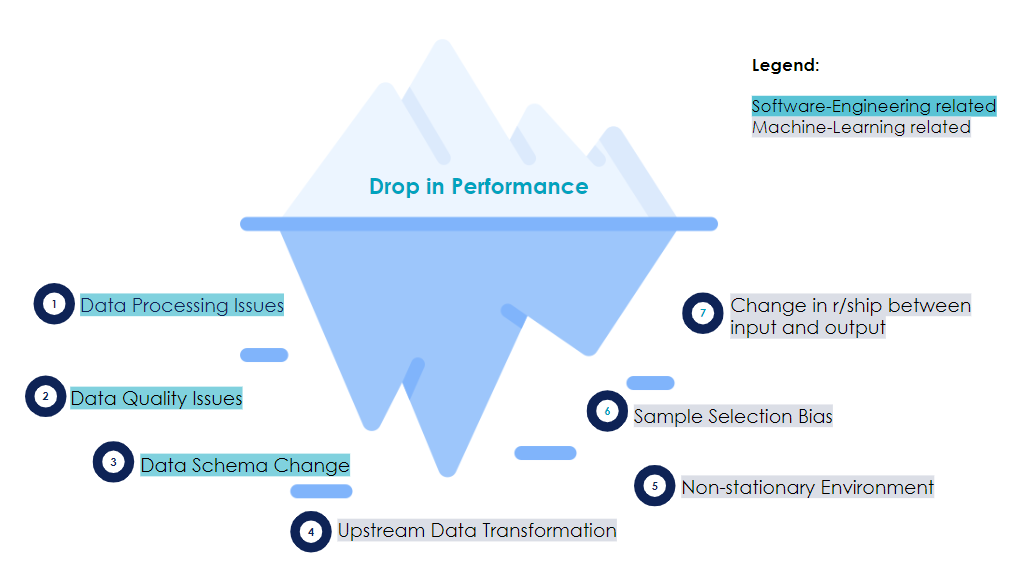
As the previous image shows, a drop in a model performance may be due to numerous factors. Those factors can be summarized in two big categories: Software-Engineering related failures and Machine-Learning related failures [5]. Software system failures are the most frequent. According to two engineers at Google who investigated the source of 96 outages over the past 15 years, they represent approximately two third of the total failures [15].
A software system failure can be caused by a data schema change: for instance if you were collecting distances in kilometers and it suddenly changes to meters following an API update...
It can also be caused by data processing issues such as an infrastructure update: you got a new version of a database with some updated column names [8]. Finally, imagine that some part of the data is lost, then it is a data quality problem.A Machine-Learning specific failure is trickier to detect because the model is still working, but not well. This is the focus of this article, and more precisely the Machine-Learning specific failures caused by data itself changing across time: also known as concept drifts.
What is a concept drift?
Depending on the articles you could find, a concept drift may mean slightly different things. There is no consensus or universal definition. We will use the definition in Webb’s article “Characterizing Concept Drift”: “a concept drift occurs between times t and u when the distributions change” , where u means t + n additional days. (Geoffrey I. Webb, 2016) [15]. In other words, the data will behave differently in time t and u. Concept drift is then split into two sub-concepts: virtual concept drift and real concept drift.
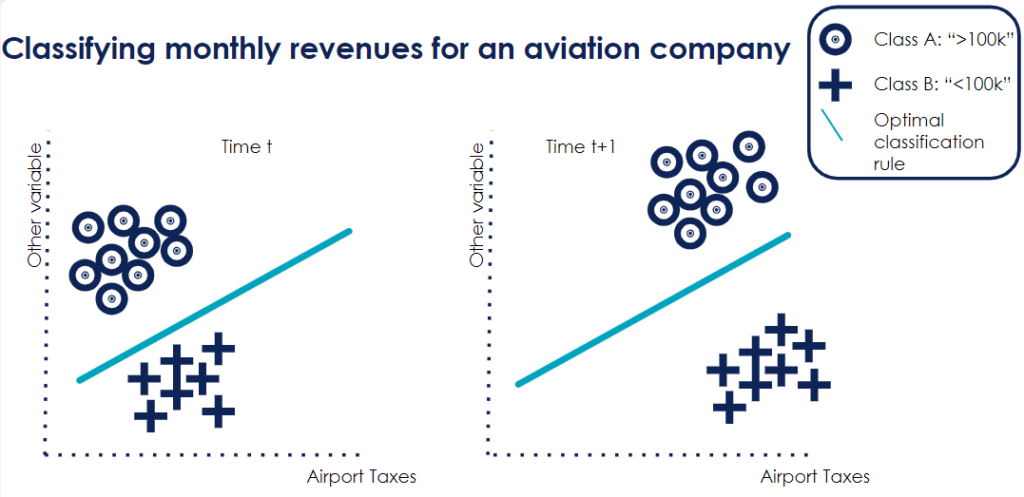
Virtual Concept drift means that the data changes, but it will not impact the model too much: the optimal classification boundary will remain the same. This is why it is called virtual: the data distribution changes but not the model.
Let us have a look at the below graph. We could say that Class A means monthly profits higher than 100,000 euros (“>100k”) and Class B profits of less than or equal to 100,000 euros (“<=100k”). Let us assume further that airport taxes are a significant variable used in our model and due to a change in regulation, they increase. We will therefore see a shift in the distribution of this tax variable and will probably see more points belonging to class B: profits of “<=100k”. However, the decision rule will remain the same: the relationship between profits and taxes has not changed.
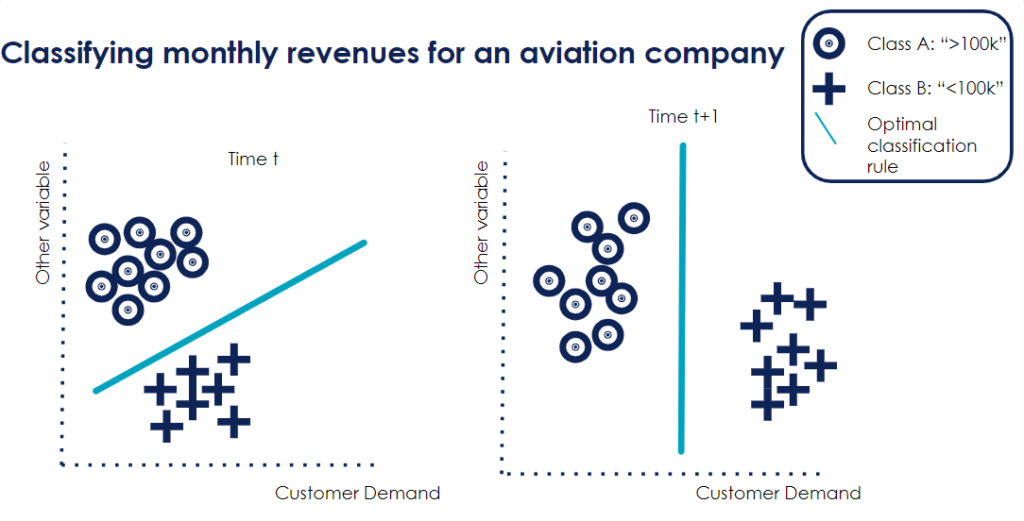
In contrast, a real concept drift illustrates a change in the relationship between the target variable and its predictors. A common illustration is the Covid-19 pandemic: a pre-pandemic model would not accurately predict the steep decrease in monthly profits .
But a real concept drift does not have to be as drastic as a pandemic. Think about people becoming more eco-conscious and starting to limit how often they travel by plane. That would lead to a real concept drift: a significant variable - customer demand – changes and will very likely impact the decision boundary.
This is illustrated in the below graph.
Anatomy of a concept drift
Now that you understand the difference between the real and virtual concept drifts, there are other key attributes to identify a concept drift: duration, transition period and recurrence. This will be useful to know during the detection phase.
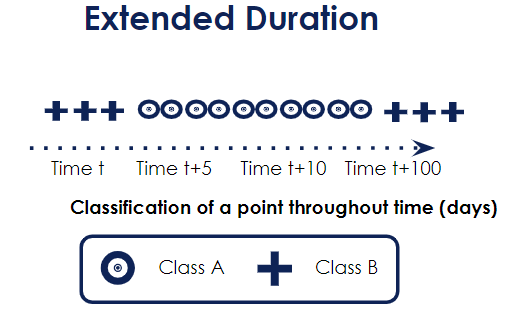
Duration: how long does it last?
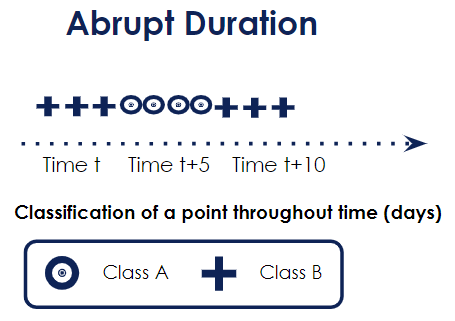
It can last for a very short time : we call it abrupt. An illustration could be Black Friday sales. For a few days only, the customer behavior is drastically different from the rest of the year.
As shown in the below graph, the classification of a point changes at time t but very quickly (5 days later) it goes back to normal.
It can also be longer: an extended drift. For instance, an economic recession. The below graph illustrates the situation of an extended drift: the classification of a point changes at time t. It is only 100 days later that it reverts to its original class: class B.
It can also last forever: it will never reverse.
Transition: how does it transition from A to B?
You have the previous state of your variable: A. After the concept drift occurs, your variable has changed: it is in state B. However, it is not clear how your variable goes from state A to B.
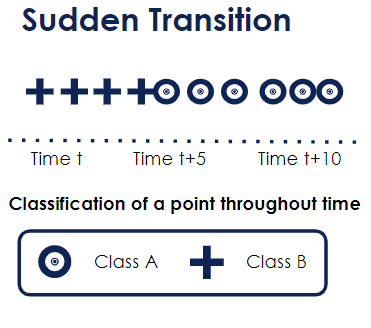
It can be a sudden change: from one moment to another, your variable goes to state B. The Covid-19 pandemic would be an illustration of a sudden transition.
The below graph demonstrates a sudden change: the classification of a point suddenly changes from Class B to Class A.
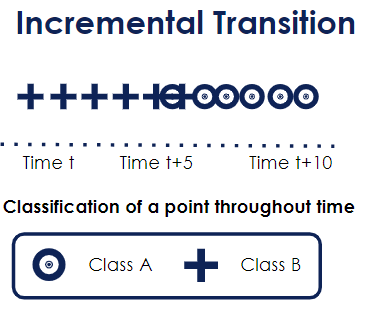
It can also be an incremental change: step by step the variable moves from one state to another. This is more subtle and difficult to detect. For instance, a change in customer’s buying habits (from physical shops to e-commerce).
As shown below, we can spot that around time t+5, it is uncertain whether a point should be classified as Class A or B. An incremental change should behave the following way: around time t+4, there should be more chances that it is classified as Class B and as time passes, it is more likely to be classified as Class A.
Recurrence: does the drift repeat itself?
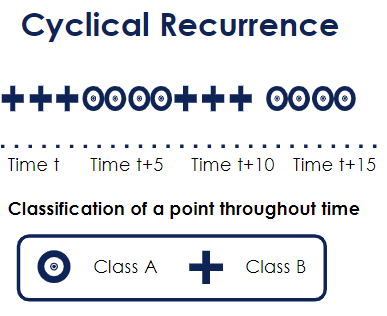
The last attribute deals with seasonality. It is possible that the drift occurs every year at the same period: that would be a cyclical drift. It can also be non-cyclical: it reoccurs but not at the same period every time. Finally, the drift can just be a one-off and will be called non-recurrent.
The below graph illustrates a cyclical recurrent drift: we can see that the change of classification from B to A occurs every 5 timestamps.
To drift or not to drift?
It was important to go through the different types of drifts for two reasons. Firstly, you will find that some types of concept drift are easier to spot than others. Moreover, there is no winner-takes-all method: some methods will be efficient for some drifts, other methods for other drifts. Who said detecting drifts would be easy…?
Overall, there are three big families of drift detectors: drift detectors with labels, univariate drift detectors without labels and multivariate drift detectors without labels. We will go through each of them and explain a specific methodology.
Drift Detectors with labels
Those drift detectors use labels: the true “Y”, or ground-truth. Using those labels, some metrics are calculated comparing the predicted and actual results such as the error rate. Furthermore, a monitoring system is put into place with warnings and alarms. A warning will be sent if the monitored metric reaches a given threshold and an alarm will be sent if the metric reaches an even higher threshold.
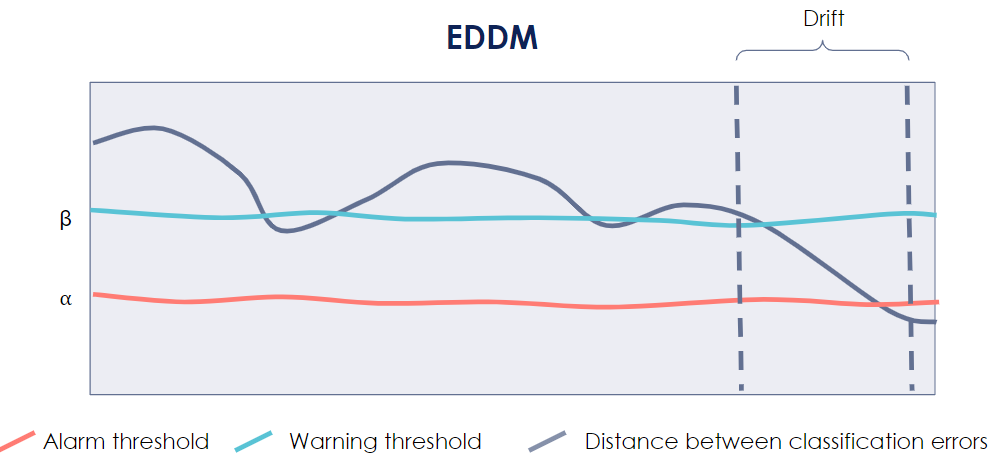
The Early Drift Detection Method (EDDM) [9] uses as a metric the distance between two consecutive errors. The closer are two consecutive errors, the more likely it is that the data has drifted.
The below picture illustrates how the EDDM algorithm works. Between the two dotted lines, the distance between two consecutive errors has become drastically smaller. Firstly this distance becomes smaller than the beta threshold, which raises a warning. Then, it becomes smaller than the alpha threshold, leading to an alarm: a drift has probably occurred!
If you can have frequent, fast, and inexpensive access to these labels, then you should really adopt one of those drift detectors. However, if you cannot (let’s say you want to verify whether your prediction that an individual reimburses its mortgage is correct, you would have to wait at least a decade…) then you might want to have a look at the remaining two families.
Univariate Drift Detectors without labels
Those detectors are the most widely used in the industry. Indeed, they do not need labels which makes them suitable for many use cases. Secondly, they mostly rely on statistical tests: this is fast to implement and easy to understand.
A statistically-famous one is the Kolmogorov-Smirnov Test. It is used to test whether the two samples come from the same distribution. This is illustrated in the below picture. [6]
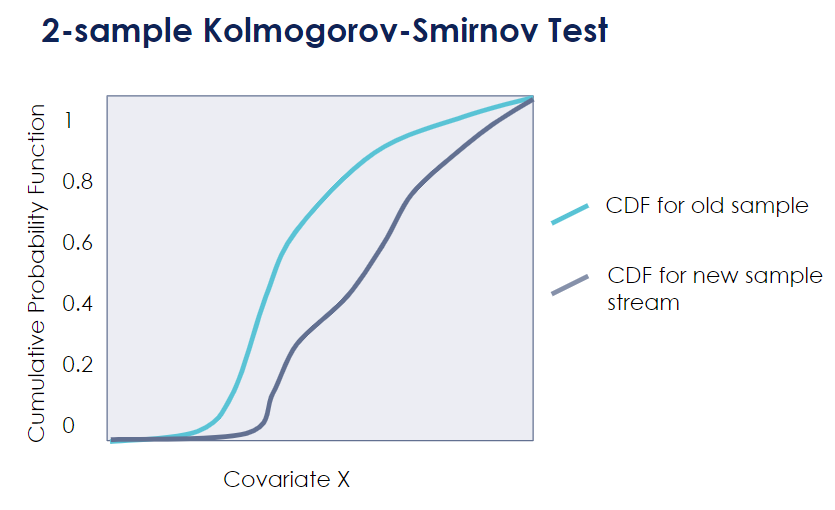
However, one major drawback of this family of drift detectors is that it is limited to virtual concept drifts. A virtual concept drift will check for changes in the variables distribution. However, as we saw earlier, a distribution change does not always mean a change in the relationship between the covariates and the dependent variable.
Back to the airline example: detecting an increase in the variable “airport taxes” will help detecting a virtual concept drift, but not a real concept drift.
Moreover, how can we detect a real concept drift of airline customers becoming more eco-conscious only by looking at the variable distributions?
Unless you are interested in covering virtual concept drifts only, it is recommended to go through the last family of drifts detectors.
Multivariate Drift Detectors without label
Multivariate Drift Detectors without labels aim to address the following problem: what if you do not have access to labels and you want to be able to detect both virtual and real concept drift as efficiently as possible?
More precisely, this family of detectors rely on properties of unlabeled data feature values, to signal deviations. They can be very powerful, but it is important to be aware that they are not currently used in industry: there are no existing libraries or tools to use. Indeed, the drift literature is very recent and those unlabeled multivariate drift detectors only start to become popular in research articles.
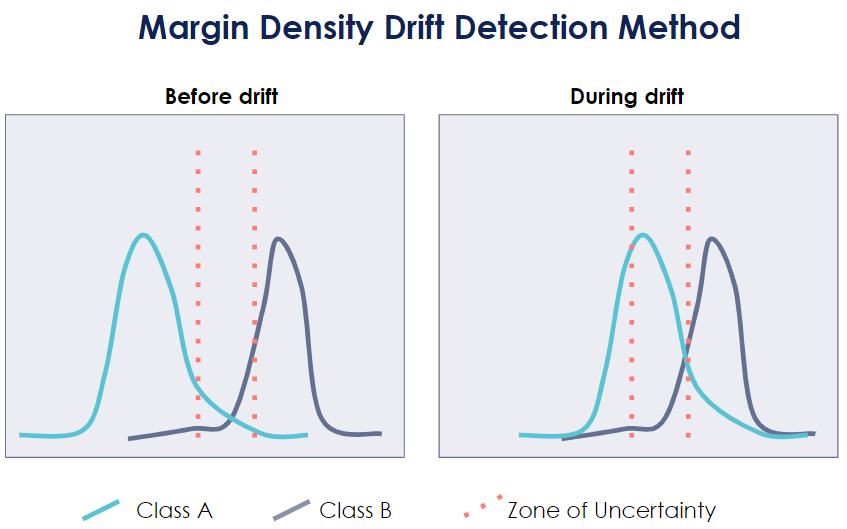
The Margin Density Drift Detection (MD3) algorithm is a particularly interesting methodology since it tracks changes in the expected density distribution in the margin. By margin, we mean the region of uncertainty of a classifier which is close to the classification boundary. Any significant change in the density distribution of the margin will have to be investigated. [13] [14]
The below graph illustrates a scenario of an increase in the density distribution in the zone of uncertainty of a classifier. This would raise an alert.
The existing concept drift toolkit
You have now gained insight into the different families of drift detectors with their respective advantages and disadvantages. In this last part of the article, we will cover some existing tools that can be used to detect drifts. You can also refer to the Toolkit Comparison table in the Appendix.
Drift monitoring has gained in popularity since the last few years. Any big cloud provider will have its own drift monitoring feature:
Vertex AI Model Monitoring for Google Cloud Platform. As of May 2022, it only provides Univariate Drift Detectors methods without labels (Jensen-Shannon divergence and L-infinity distance). A monitoring system of alerts and warnings can be implemented. [12]
Amazon SageMaker Model Monitor for Amazon Web Services. It also provides an advanced monitoring system for the Machine Learning models in production and generates reports. There is little information about the drift detection methods used. [10]
Watson OpenScale Drift Monitor for IBM Cloud also provides a monitoring dashboard for detecting drifts. It uses a range of different methods to detect a drop in consistency and accuracy including some drift detectors with labels (DDM). [1]
Azure Machine Learning for Microsoft Azure includes as part of their features a drift monitoring functionality but there is little transparency regarding the metrics used. What is known is that the platform does not tackle real concept drifts. [7]
There are also open-source tools which can be used to detect drifts:
TensorFlow Data Validation is widely used in the industry and can be integrated with Google Cloud Platform. It provides data visualization tools for monitoring but its detection methods are only limited to the same Univariate Drift Detector methods as for Google Cloud Platform. [3]
Evidently AI is another tool for monitoring. It is also very graphic and user friendly and generates monitoring reports. It provides a wide range of Univariate Drift Detector methods (Kolmogorov-Smirnov (K-S) test, Chi-Squared test etc.). However, those methods are only covering univariate statistical tests. [4]
Deep Checks is an open-source package for data validation. It is more of a testing and validation tool rather than a monitoring tool. Its main drift detector methods are mostly univariate: Population Stability Index (PSI) and Wasserstein Distance. Yet, it also includes a multivariate detector method: "the Whole Dataset Drift". [17]
Scikit Multiflow Library is a Machine Learning python package which contains a wide range of Labeled Drift Detectors methodologies: DDM, EDDM, PageHinkley, ADWIN etc. If the access to labeled data is possible, it can be a powerful addition to any monitoring system.[18]
Finally, private platforms can be an option:
- Fiddler AI [11] and DataRobot [2] seem to be both valid monitoring and drift detection tools. However, there is a lack of transparency regarding the drift detectors used.
In conclusion, there are a variety of tools which can be used to monitor your Machine Learning model. However, except for the Scikit Multiflow Library, their drift detection offering is mostly limited to one type of family: the unlabeled Univariate Drift Detectors methodologies. Efficient with virtual concept drifts, they are performing poorly in detecting real concept drifts.
Evidently AI provides the widest range of univariate drift detectors alongside a user friendly monitoring dashboard.
The Scikit Multiflow Library can also be a very useful tool if it can be integrated into a monitoring tool.
Final thoughts
You now have the tools to investigate what happened in your airline monthly profits model!
Throughout this article, we have navigated through the main types of concept drifts and discovered the three main families of drift detectors. All have their respective advantages and disadvantages and shall be carefully considered depending on the use case. For instance, if your airline company has access to labels, you can pick the Labeled Drift Detectors family.
We concluded the article by covering some existing tools to help with drift detection. Despite a very limited offering, they can help you quickly get started with drift detectors. If you already use a Cloud Monitoring system, you will find it very practical to use their own drift detection tool. Yet, Evidently AI and Scikit Multiflow Library provide the widest offering in terms of drift methodologies but it will probably take more time to integrate it with your monitoring system.
Next time, we will dive deeper into the detectors and their respective performance towards detecting drifts: Let’s code: Drift and Detect! - OCTO Talks !
References
“Configuring Drift Detection.” Configuring Drift Detection - IBM Cloud Pak for Data as a Service, https://dataplatform.cloud.ibm.com/docs/content/wsj/model/wos-monitor-drift.html?locale=en.
“Data Drift Tab.” DataRobot Docs, https://docs.datarobot.com/en/docs/mlops/monitor/data-drift.html.
“Get Started with Tensorflow Data Validation : TFX : Tensorflow.” TensorFlow, https://www.tensorflow.org/tfx/data_validation/get_started.
“How It Works.” What Is Evidently? - Evidently Documentation, https://docs.evidentlyai.com/.
Huyen, Chip. “Data Distribution Shifts and Monitoring.” Chip Huyen, 7 Feb. 2022, https://huyenchip.com/2022/02/07/data-distribution-shifts-and-monitoring.html.
“Kolmogorov–Smirnov Test.” Wikipedia, Wikimedia Foundation, 22 Apr. 2022, https://en.wikipedia.org/wiki/Kolmogorov%E2%80%93Smirnov_test.
Kulkarni, Prasad. “How to Detect Data Drift in Azure Machine Learning.” Datasset to Mindset, 19 July 2021, https://www.data4v.com/how-to-detect-data-drift-in-azure-machine-learning/.
“Machine Learning Monitoring, Part 3: What Can Go Wrong With Your Data?”, Evidently AI, 9 Sep 2020, https://evidentlyai.com/blog/machine-learning-monitoring-what-can-go-wrong-with-your-data
Manuel Baena-Garca Jose, José Del Campo- Ávila, Raúl Fidalgo, Albert Bifet, Ricard Gavaldà and Rafael Morales-bueno. “Early Drift Detection Method”, 2005, https://www.cs.upc.edu/~abifet/EDDM.pdf
Mishra, Abhishek. “Machine Learning in the AWS Cloud: Add Intelligence to Applications with Amazon Sagemaker and Amazon Rekognition.” Amazon, John Wiley & Sons, 2019, https://docs.aws.amazon.com/sagemaker/latest/dg/clarify-model-monitor-bias-drift.html.
“ML Monitoring: Fiddler Ai.” ML Monitoring | Fiddler AI, https://www.fiddler.ai/ml-monitoring.
“Monitor Feature Skew and Drift | Vertex Ai | Google Cloud.” Google, Google, https://cloud.google.com/vertex-ai/docs/model-monitoring/using-model-monitoring.
Sethi, Tegjyot Singh, and Mehmed Kantardzic. “Don’t Pay for Validation: Detecting Drifts from Unlabeled Data Using Margin Density.” Procedia Computer Science, vol. 53, 2015, pp. 103–112., https://doi.org/10.1016/j.procs.2015.07.284.
Sethi, Tegjyot Singh, and Mehmed Kantardzic. “On the Reliable Detection of Concept Drift from Streaming Unlabeled Data.” Data Mining Lab, University of Louisville, Louisville, USA, 31 Apr. 2017, https://doi.org/https://doi.org/10.48550/arXiv.1704.00023.
USENIX Association, director. OpML '20 - How ML Breaks: A Decade of Outages for One Large ML Pipeline. YouTube, YouTube, 17 July 2020, [https://www.youtube.com/watch?v=hBMHohkRgAA. Accessed 5 May 2022.](https://www.youtube.com/watch?v=hBMHohkRgAA. Accessed 5 May 2022.)
Webb, Geoffrey I., et al. “Characterizing Concept Drift.” Data Mining and Knowledge Discovery, vol. 30, no. 4, 2016, pp. 964–994., https://doi.org/10.1007/s10618-015-0448-4.
“Welcome to Deepchecks!: Deepchecks Documentation.” Welcome to Deepchecks! - Deepchecks d6c0ce1 Documentation, https://docs.deepchecks.com/stable/index.html.
“Welcome to Scikit-Multiflow's Documentation!¶.” Scikit, https://scikit-multiflow.readthedocs.io/en/stable/index.html.