Identify performance issues in your Android application
A smooth user experience is a common attribute of all the successful Android applications. It might sound as an obvious statement but many are the applications that are a little bit “laggy”. Moreover android developers are use to test their application mostly on high-end devices (generally their own devices), forgetting that their app will be run on cheaper devices, which will deteriorate the app smoothness a lot.
It is pretty easy to find documentation on the Internet that will give you advices to have an efficient android application (for instance the great android performance documentation page itself). In this article we propose the opposite: presenting tools that will help you benchmarking an existing Android application in order to find some room for improvement. It can also be a way to measure improvements when we are doing some performance related tasks. We will try to have first a macroscopic approach and then will go deeper and deeper in the analysis in order to find the hidden cause of a performance issue. Some of the tools I will talk about are part of the android standard build tools, some are “external” products. All of them have proven their efficiency on the projects I have worked on, including Le Monde applications which are massively downloaded (over one million downloads) and need to be performant even on low end devices .
In the first part we will see how we can identify app launch slow downs thanks to two tools: Nimbledroid and AndroidDevMetrics. In the second part we will focus more generally on User Experience (UX) issues by using standard Android tools.
1. Monitor app start up time
App start up time is a critical metric every developer (and the product owner (PO) ) should monitor carefully. A long start up time will create a lot of friction between the user and its utilization of the application. This is particularly true when it comes to applications that are meant to be used quickly. Would you use regularly your favourite public transportation application if you need 5 seconds each time you want to use it ?
In this first part we will focus on global tools i.e. benchmarking tools that can be used by a non technical person (for instance the product owner of the application). Indeed if it is developer's responsibility to produce efficient code which will ensure good performance, the product owner must be able to quantify the application slow downs. Doing so, the PO will be able to set objectives instead of emitting a subjective statement such as "the app seems to be slowing down these days".
Nimbledroid
Nimbledroid is a free (without advanced support) service dedicated to measure Android application start up duration. The key value added of this service is the measure of the start up time on a real device and its monitoring over a middle/long term. An example of interesting output we can obtain is the following:

We can see on this chart that it is possible to compare cold start up time for different versions of the application. In that case for instance, there is a downward trend. All the information generated by Nimbledroid analysis are accessible directly on their website which makes this tool convenient to use for anybody.
The list below go over the tree ways to provide inputs to Nimbledroid, sorted in ascending order of the facility to give the input to the service.
- Play store channel. Easy as pie: you type the name of a store application you want to analyse , click on "request profiling", wait few hours and you are good! The profiling operation is stored in Nimbledroid database so everyone will have access to the profiling information. If you want to be sure that the profiling information correspond to the last version of the app you can request a new profiling to have updated information.
- Manual upload channel. This channel is particularly useful when you want to test an app version that is not on the store. You just have to drag and drop the apk file of the application and wait a few hours. With this channel your profiling is private (you need to log in), you are notified by email when the profiling is ready.
- Automated channel. This channel is the "hardest" to set up but also the most powerful. Nimbledroid provides a gradle plugin to make CI integration possible. After a few configuration steps you will be able to push automatically apk to Nimbledroid and ask for a profiling. This channel is particularly interesting as the profiling is now automatic and a tracked metric.
This tool is quite powerful as it is very easy to feed the service with inputs and that the results are readable by anyone (no need to be a developer).
If we sum up this tool characteristics we end up with the following table:

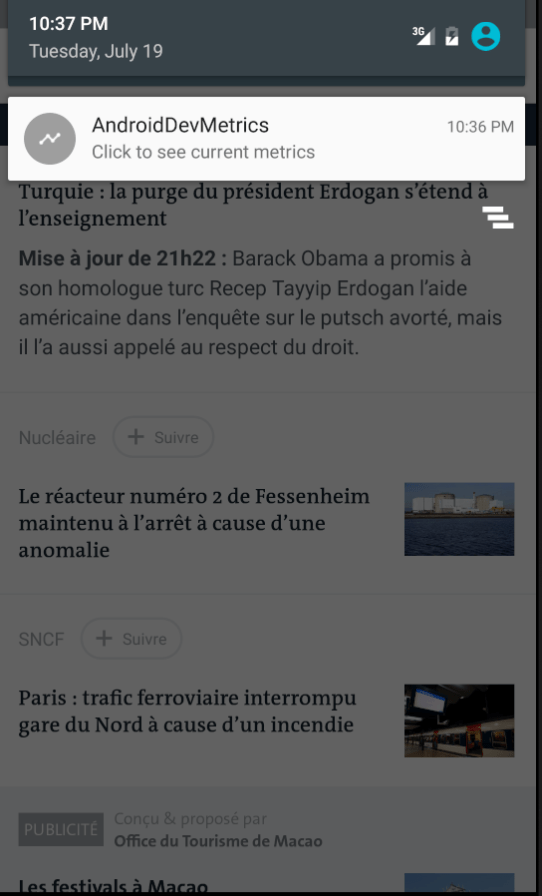
AndroidDevMetrics
AndroidDevMetrics is a tool embeddable directly in your application (the debug version). It will give you several performance-related information such as: activity lifecycle methods execution time, Dagger 2 object instantiation duration, and fps frame drops. All these information are available as you crawl your application from an activity to another in the notification center (see screenshots below).
 (2) Dagger objects generation duration
The other great asset of this tool is that you can monitor carefully how long does Dagger 2 take to inject objects in your activity. Why is important ? Dagger 2 is a great tool but may leads to important slow down if not used careful. Indeed, when you inject your graph, Dagger 2 will create all the objects needed by the activity (based on the scope you defined): he will call the code of your providing methods defined in your module class. If the provider method code takes too much time it will slow down the whole activity start up. Screenshot 2 (above) shows an object ( InitializeDataManager ) which takes too much time to be instantiated on a UI thread. By identifying these bottlenecks it is easy for the developer to set up strategies delaying this object instantiation (for example with the utilization of lazily computed value).The following table summarizes strengths and weaknesses of this tool:

2. Identify precisely UI slow down issues
Let's now review the most useful tools when it comes to optimize the UI performances of an application. Of course there are many tools that can help identification of UI issues and give information on the performance issue reasons. In this article we will focus on three tools that have a different granularity and different purposes.
We could also have put AndroidDevMetrics in that category, meanwhile I considered that the key value of AndroidDevMetrics is to provide information related to activity startup not general information about what is made in the UI thread.
GPU overdraw visualizer

Let's start with the most "basic" UI analyser available on the android platform: the overdraw visualizer. This tool is available directly in the "developer options" of your Android device. You just have to enable the field "Debug GPU overdraw". You will now see many colors superimposed on your screen. Each of these color tells you how many times the corresponding area has been overdrawn by the GPU. A transparent/blue/green color corresponds to a low number of overdraw (respectively 0, 1, and 2), a red color corresponds to a "high" overdraw number (3 or 4). Of course, the lower the overdraw number is, the better. Indeed if you spot too many area with a high overdraw number in you application it means that the GPU is spending too much time for doing a job he has already done previously. It may seem insignificant on your device but it might lead to important slow down on low-end devices.
As you can guess, this tool main's asset tool is that he is really easy to use: no need to plug your device to the computer and read some unclear stacktrace dumps. By simply identifying the different colors, the potential issues will become straightforward. Another asset of this tool is that it allows you to do exploratory investigations over your application. Even if you do not know where is the performance issue of your application, you can browse it "randomly" to discover some UI performance issues. These assets come with a major drawback: once you have identified the global pixel area which is overdrawn, you will have to do a deep analysis to identify the problematic view and why it is overdrawing.
You can find some common overdraw reason and how to solve it in this Android perf video.

Traceview
When you want to do a more advanced analysis (or when you want to identify a performance issue reason), the Traceview tool will be a powerful ally. Traceview is part of the Android Device Monitor toolset provided by Android Studio. There are two ways of analysing a trace thanks to Traceview:
- Programmatically. You have to programmatically put instructions in your code to indicate where you want to start the profiling and when you want it to end (see method tracing related methods of the Debug singleton). This solution advantage is that you will mark out precisely your analysis. Meanwhile, it means that you need to know where problematic instructions will be called. When you will execute your app and go through these two methods, you will end up with a .trace that you will be able to import in Traceview (file->open).
- Directly in Traceview. When you open Traceview you will be able to start profiling directly by clicking into your process in the device panel and then clicking on "start method profiling". You can now execute on your device the cinematic you want to profile on your device. When it's over, simply click on the "stop profiling" icon
You have now a trace dump displayed in Traceview. Traces can be quite complicated to read so here are some information that you might find useful, complementary to the Traceview official user guide:
- Traceview outputs table includes many columns. Most of the time, many of them will not be interesting. The two most important metrics you should focus on are the following: Incl Cpu Time % and Excl Cpu Time %. The first metric is related to the CPU duration percentage spent inside the method (for instance doing a primitive operation, waiting a system I/O input...). The second one designate the CPU time spent executing the whole method i.e. it includes the subcalls of your method. Typically, you will use the first metric to identify inefficient algorithm you might use, the second one will be powerful to spot bottlenecks calls that could be made previously or asynchronously.
- The trace dump shows all the thread running in your process. It means that you will find all the operation executed asynchronously. When you want to check if a suspicious CPU-consuming method is called on the main thread, just click on it in the list and the calling thread will be highlighted in the thread chart in the upper view.
- Do not use the duration displayed as a precise benchmarking tool. As you can notice the UI is particularly slowed down when the method tracing is running (this is due to the deep analysis of the call stack made in "runtime"). Therefore, the durations displayed are longer than the "regular" duration. Prefer percentage metrics.
As you have noticed, Traceview is a tool allowing very precise analysis. Meanwhile it is also a complex tool that can be used only when we have an idea of where is the problem. Moreover the poor user experience of the interface requires a few times to get use to it.

Logcat analysis

It might seem to be the most rudimentary tool but logcats outputs can sometimes be useful to have a brief idea of eventual performance issues in the application. Indeed if you read carefully the logcat output of your application, you might notice some entries that look like something like that:
Choreographer: Skipped 41 frames! The application may be doing too much work on its main thread.
This entry description is self-explanatory: as an important amount of computation is done on the main thread, the Android Choregrapher is not able to refresh the screen display as it should. The Android Choregrapher is an internal Android class dedicated to display views on the screen. If too much work is down on the main thread, the rendering method of the Choregrapher will not be called between two frame-refresh which means that some frames have not been displayed on the screen.
If it happens when the screen is "static" it will not be perceptible by the user. However, if it happens when there is an animation being displayed, then the animation might look laggy.
As for other performance warnings, a single occurrence of this message is not a problem in itself, particularly if your app is running on a low end device. It is when you notice several occurrences of this message that you might have to consider investigating.
Another UI-related performance log message you may encounter is something that look like this:
dalvikvm: WAIT_FOR_CONCURRENT_GC blocked 176ms
an equivalent message for devices using ART is the following (the previous one is for a Dalvik powered device):
art: Starting a blocking GC Background
These messages are displayed when the Java Garbage collector (GC) is running. The GC typically runs when the Java heap limit of the system is reached. During this garbage collecting operation, the GC is freeing all the non longer used Java objects. This operation can be quite long and needs to pause all the running threads (including the main thread) to avoid inconsistency. The consequence of this is that your screen will freeze until the garbage collecting is over.
A typical origin of too many occurrences of this message is a memory leak in your app which leads to too much consumed memory and therefore a GC that has to run too frequently.
Conclusion
With this article you are now well equipped to have a fair idea of how efficient your app is and what are the main bottlenecks that you have to address in order to make your app more confortable for every users. The tools are presented in this article with a "theoretical" point of view, if you want an example of how some of this tools can be applied on a concrete app, check out this great Romain Guy's article.
Of course this knowledge is only the first (but not necessarily the easiest) step. Once you know where is the problem you have then to fix it. In some cases it may be really easy and quick but sometimes it will take be a long-span task. The diversity of the ways to fix a performance issue is so big that it is not possible to make an exhaustive list, meanwhile you take a look at the Android Performance Playlist which presents many useful tips. It is also important to notice that the easiest performance issue to fix are the one which have not been created in the past! Take care to follow all the Android performance best practices and you will not have to spend to much doing a posteriori analysis.