Ansible reporting with ARA: Ansible Run Analysis
̛I had a Slack conversation with some friends from work (B, R and G) the other day. It went somewhat like this: B: “Hey, have you guys ever heard of ARA?”
This was followed by 5 minutes of the deafening sound of contextualisation and Google searches by everyone on the channel. R: “Nope, but every piece of technology that could enable Ansible to catch up with PuppetDB/Board would be very much appreciated”
G: “Reporting is cheating” (This statement makes way more sense in French)
Me: “It looks dope, it’s way better than scrolling through the output of a Jenkins job and you won’t be needing things like profilers anymore. I’ll try it and I’ll tell you if it sucks or not”
So this is it.
What is ARA?
ARA is an acronym. It means Ansible Run Analysis. It provides you with a detailed analysis of your Ansible playbook runs, which includes:
- Tasks description, status and output
- Play description and duration
- Hosts involved
- Files executed
- Parameters used
And a bunch of other cool things. We will take a look into that in a second. Yeah, really.
How does it work?
Basically ARA is an Ansible callback. It records everything related to a playbook’s execution into a database, which is SQLite by default. That’s it. As simple as possible.

At least that’s the most important part. But also included with ARA is a CLI which allows you to query the aforementioned database interactively, a web interface coded in Flask which allows you to check out all of your data dynamically, and two Ansible modules: ara_record and ara_read. I’ll talk about these two later.
How to install it?
It depends on what you want to do with it, really.
You can have a simple local database for testing purposes, or if you’re working on a project by yourself and you feel like recording everything you’re doing for further analysis. If that’s your use case, then the process is really simple. You just need to install the ARA dependencies:
# RHEL

yum -y install gcc python-devel libffi-devel openssl-devel redhat-rpm-config

# Ubuntu

apt-get -y install gcc python-dev libffi-dev libssl-dev
And then install it using pip:
pip install ara
This will create a .ara directory at the user’s home, with an SQLite database inside of it, as well as a logfile. Then, in order to launch the dashboard, just use some `ara-manage` magic:
ara-manage runserver
This will launch the development server which will listen on port 9191 by default. You can specify different IP and port settings by using the -i and the -p options, respectively. After this you’re all set, and you can go and see all your beautiful dashboards on the web interface.
Then again, you’ll probably want your dashboard to be accessible at all times if you’re working on a serious project. What I did was that I installed ARA in the same machine where I installed the Jenkins server, I created a systemd unit file in order to launch the dashboard as a service, and I exposed it using nginx. Simple.
The ARA installation part remains the same for this case, unless you want to use MySQL or PostgreSQL instead of SQLite. I didn’t. Here’s a guide of the schemas you’ll need to create and the extra configuration variables you will need to add in that case.
Your service file will look somewhat like this one:
[Unit]

Description=ara

After=network.target


[Service]

User=jenkins

Type=simple

TimeoutStartSec=0

Restart=on-failure

RestartSec=10

RemainAfterExit=yes

ExecStart=/usr/bin/ara-manage runserver -h 0.0.0.0 -p 9191


[Install]

WantedBy=multi-user.target
You can change the IP and the port by modifying the ExecStart instruction on the Service namespace of the file. Note that I’m starting the process as the Jenkins user, since it’s the same user that will be running the Ansible playbooks. Moving on.
For nginx, you get something like this:
server {

    access_log /var/log/nginx/access_ara_ssl.log.json json;

    access_log /var/log/nginx/access_ara_ssl.log;

    error_log /var/log/nginx/error_ara_ssl.log;


    listen 443  ssl http2;

    ssl_certificate /etc/nginx/certificats/ara.mycert.crt;

    ssl_certificate_key /etc/nginx/certificats/ara.mykey.key;

    server_name ara.amazing.io;

    location / {

        proxy_pass http://jenkins-ip:9191;

  }

}
And that’s it. Your service will be accessible on the host. You can also use Apache if you want, or any software capable of working as a reverse proxy for that matter.
Finally, you also need to tell Ansible to use the ARA callback. This needs to be done no matter which installation option you choose. It is fairly simple though. You just need to add the following lines to your ansible.cfg file:
[defaults]
# Callback
callback_plugins = $ara_location/plugins/callbacks


# ara_record and ara_read modules
action_plugins = $ara_location/plugins/actions
library = $ara_location/plugins/modules
The next time an Ansible playbook is executed, the ARA callback will connect to the SQLite database located on the .ara directory of the user’s home directory. You can also configure these as environment variables. Just in case (shrugs).
Playing with ARA
Let’s talk about the Ansible modules and the CLI.
The modules are called ara_record and ara_read. These allow you to do some cool things. The first one, ara_record, allows you to record data using a key/value format, just like you would do with an Ansible fact. In other words, something like this:
- name: Record useless value
ara_record:
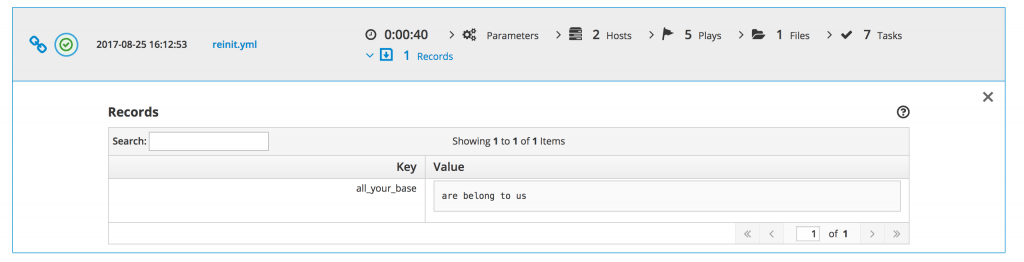
key: “all_your_base”
value: “are belong to us”
Which will translate into a record on the ARA database, or something like this on the dashboard:
You can also record things using the ad-hoc command directly, like so:
ansible localhost -m ara_record -a "playbook=7ab3858f-5d17-48f1-bb94-19ccdec0c983 key=all_your_base value='are belong to us'"
You can obtain the playbook ID using the ARA CLI, with `ara playbook list`. A cool thing about this is that you can actually record data once the playbook is already done, if you have the playbook’s id.
The ara_read module, on the other hand, lets you read (duh) data that has previously been recorded on the same playbook run. This is interesting, because it enables you to use it across plays as long as you stay within the playbook’s scope. Thus, you can record a value and then use the same value on a different play, like an ID, an IP, the output of a command, or almost anything you can think of.
Honestly, I don’t see any amazing use cases for this module. I think that if you’re using this as a key element in order to pass data between your plays, you’re basically structuring your playbooks/roles/plays the wrong way. But that’s just me.
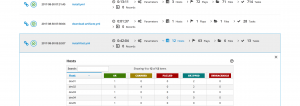
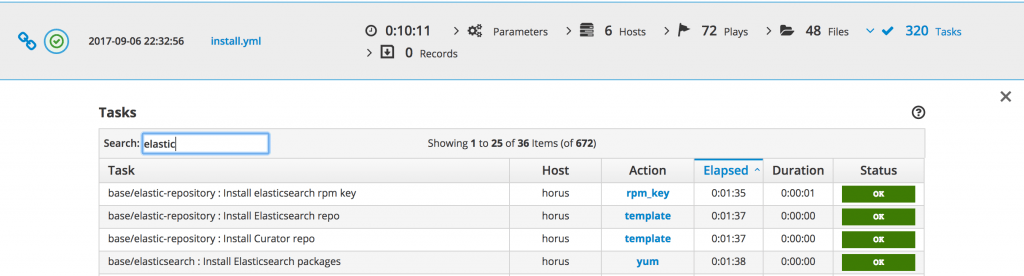
Finally, the web interface is quite cool since it allows you to filter information by hostname, keyword, or status. This is particularly useful when you’re trying to see the changed, or failed tasks of a playbook, or when you’re trying to see all the tasks linked to a certain role or middleware.
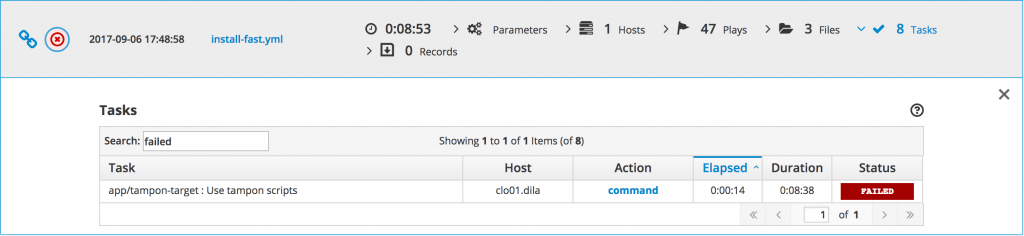
Search by status
Alright, let’s recap.
It’s great because:
- It helps you troubleshooting your playbooks easily. You can search the information you want to find on the dashboard, instead of browsing through the extremely long output of a Jenkins job trying to figure out what went wrong
- It’s super easy to install it locally, and relatively easy to do it on a dedicated machine, exposed through a web server
- It is under active development by the RedHat team, which probably means that we will be seeing some new features soon
- You can use the CLI or query the database yourself if you don’t like dashboards that much. You can also build your own dashboard by querying the database if you don’t like Flask. You probably won’t do this.
It’s not that great because:
- If you use it with a Continuous Integration server, such as Jenkins, you’ll need to check two different web interfaces in order to realize what is going on with your jobs. This is far from ideal. You can also generate static reports in HTML format, but you’ll also need a web-server in order to see them, which is a little bit annoying.
- There is no built-in database suppression purge politique. So far ARA has been running for two weeks, and we’ve got 122MB of data on a heavy-usage Ansible platform. This isn’t huge by any standards, but I’d still like to be able to delete old data automatically, without having to create a custom SQL query in order to delete the oldest playbook executions. Maybe this would go against the whole “simple is better” principle that seems to guide ARA development.
Conclusion
I really liked ARA. I think I’ll install it on every Ansible project I work on from now on. It’s a quick-win in any case.
I’d love to see better integration with Continuous Integration servers, or a simpler workflow in order to work with them. Maybe I just haven’t found it yet.
Big up to David for his work on ARA. Keep up the good work!