An APM for every project and environment
Application Performance Management (APM) is a tool to monitor and analyse the performance of software applications. With APMs, end-user response time, response times of various servers and server activity (CPU, Memory) can be collected. It is also possible, mainly for Java and .Net, to detect methods that seem problematic as well as the most costly SQL queries or blocked threads. According to the Gartner, an APM covers the following functionalities:
- End User Experience Monitoring (EUM)
- Application topology discovery and visualisation
- User-defined transaction profiling
- Monitoring of components resources usage
- Analysis and visualisation of collected data
One might say that VisualVM for Java or .NET CLR profiler cover at least some of these aspects. This is true but these tools require you to always keep an eye on the screen, literally! Moreover, it’s often impossible and dangerous to use these tools in a production environment. In contrast an APM will collect, store and aggregate this information into graphs that are easy to analyse at a later time. An APM can also send email alerts when certain thresholds are detected.
This first article in the series provides an overview of APM functionalities and shows the benefits of these tools in production, their initial target. It also demonstrates the interest to expand their use to other environments. Next posts will focus on various products available on the market.
APM on production
An APM helps to establish a culture of metrics without having to modify applications or perform specific developments.
An APM provides system and application measurements without the need to modify or recompile the applications they are monitoring. In addition to the collection and archiving of metrics, an APM can automatically analyse variations or abnormal behaviors and raise alerts. APMs also allow to view summarised data in order to analyse the causes of problems.
An APM improves communication within the company.
Beyond the purpose of accelerating data collection and use of metrics in the business, APM enables better problem solving. The first reason is the supply of reliable metrics instead of highly speculative guessing games that generate unnecessary tension. It allows teams to focus on finding solutions, not finger pointing. The second reason why APM improves problem solving is that it facilitates communication between production, development and operations teams. Through an APM instance, production metrics can be shared with the development and functional teams in order to achieve a comprehensive understanding of system operations from the business/user viewpoint to a fine-grained level like a SQL query or a function call.
Why put an APM in the development or test environments?
An APM improves performance problem-solving at a lower cost.
Consider a case where a newly implemented feature is very slow: an APM will allow to directly see where the problem is: client, application server processing, database. Of course on test environments, it is possible to activate the appropriate level of logs or use a profiler; but the advantage of an APM is that the information will be directly available to the developer. For more complicated problems like memory leaks, an APM will graphically show summary information from the Garbage Collector (GC) no time is lost analysing the logs of the GC. In qualification or performance test environments, it will be possible to obtain statistical information on the response time and the resources used by the application. Well, we already know how to do this... but often it does not get done because it requires expertise and time: you need scripts to collect measurements, you must store, sort, filter, aggregate and visualise... and furthermore you must have the skills to put all this into practice. The main argument in favor of an APM is simple: summarised information is available without the need of specialised expertise and at a lower cost.
Setup cost of APM
The cost of setting up an APM includes:
- License cost
- Infrastructure set up and administration costs
- Product installation and configuration costs
The license cost varies depending on vendors and features. For example, some vendors offer a free license model with data storage restricted to only one day. Other vendors provide special licenses for development environments.
Most APM vendors offer SaaS solutions. This approach simplifies implementations and drastically limits the associated human and material costs: no server to provide, install and manage. All you have to do is create an account online, download a zip file and register an agent (CLR or Java agent) on your servers. That's it. You can then log onto the APM site and see how your application behaves.
From a security point of view, the application connects to the cloud and sends authenticated data in a secure manner: no incoming port to open within the firewall. The connection to the APM’s user interface is secured by HTTPS and your username/password.
Finally for an investment of a couple of hours and a fraction of the cost of labour, an APM solution on a SaaS platform provides the initial results that were simply unthinkable before. In a production environment, the configuration of the APM tool may require some effort and cost to refine and validate the settings in order to minimise the impact. Some APM solutions allow to quantify their impact in terms of resources consumption.
The leading products we tested are New Relic, Ruxit, Dripstat, AppDynamics and Dynatrace. They have the advantage of being easy to implement, cloud-based and have an affordable licensing system. Note that the APM industry is erupting and there are many other products available on the market.
Let’s give it a try!
New Relic, along with AppDynamics and Dynatrace, is a leader according to Gartner (Magic Quadrant for Application Performance Monitoring, October 28, 2014) As an example, we will use New Relic to showcase the interesting features for test and development environments.
Installation
The installation is very simple. After registering on the site, you can download a zip file. Specifically, it contains the settings file named newrelic.yml already customised with your license key and the java agent: newrelic.jar. Extract the zip to a directory on your server and add Directive -javaagent:/<path to new directory Relic>/newrelic.jar in your application’s start settings. That's it. After having used your application, you can directly view its behavior.
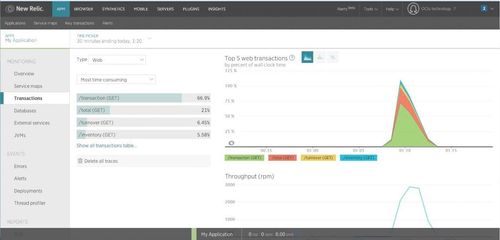
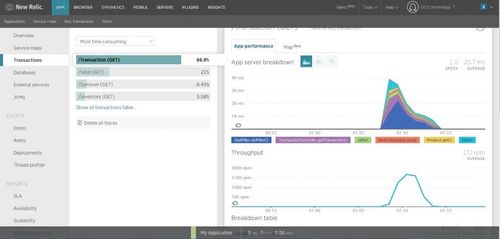
Transactions and WEB pages
In our case, our application publishes RESTs services. Without changing any settings, the product is able to analyse various requests sent to the application and provide an activity overview.
With a simple click, it is possible to perform a drill down on a query and get the longest functions and the number of calls over a period of time. Modern APMs have a very intuitive interface for fast handling.
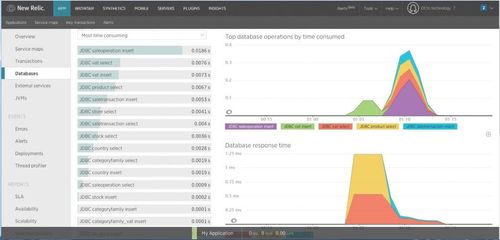
Database
The tool can capture database queries and identify the most load intensive ones. At a glance, the timing analysis shows whether the queries are performed regularly or only at certain times. Here, for example, 'vat Insert' is executed at the start of the application.
Resources
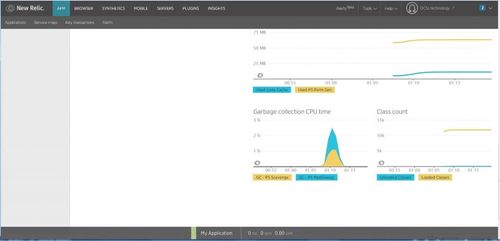
The tool lets you to visualise the evolution of memory usage within its different spaces. This helps diagnose problems like memory leaks or caches that never empty.
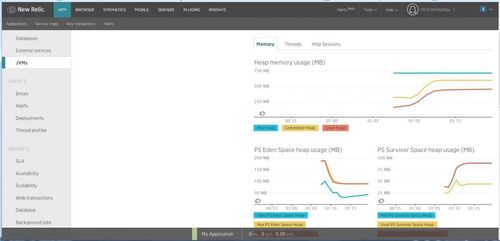
The time spent in Garbage Collection can help identify application’s slowdown problems due to excessive memory activity that are not necessarily memory leaks.
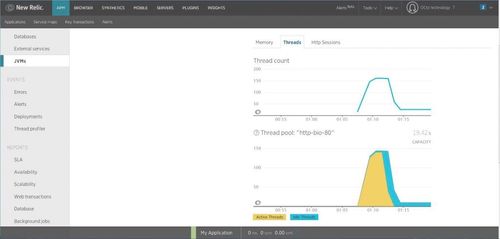
It is also possible to look at thread use information:
Various information
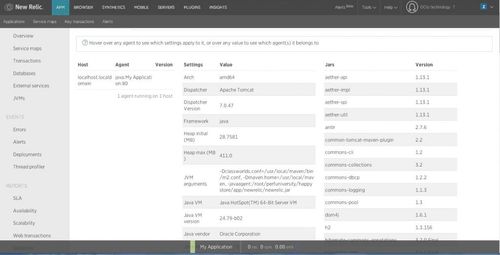
The APM captures very useful information such as JVM start parameters, the various Jars used as well as their software version.
Conclusion
In production environments, an APM is an essential component to monitor applications execution and to diagnose and understand the performance issues that may arise. Specialised developments will never be able to compete with features provided by any APM software. Note that there are also solutions to specific technologies, such as Javamelody for JEE, that integrate part of APM functionality in the application itself. On test or development environments, APM serves as the Swiss Army knife of performance. It allows teams to analyse an application execution without going through tedious settings, time-consuming logs analysis and other tools that require specialised expertise.
Finally, An APM is a great communication tool for stakeholders to gather a complete view of an application’s execution or the outcome of performance tests execution.