A Journey into Industrializing the Writing and Deployment of Kibana Plugins (riding Docker)
by Alexandre Masselot (OCTO Technology Switzerland), Catherine Zwahlen (OCTO Technology Switzerland) and Jonathan Gianfreda.
The possibility of custom plugins is a strong Kibana promise. We propose an end to end tutorial to write such plugins. But this "end to end" approach also means "how to continuously deploy them?", "how to share an environment with seeded data?" Those questions will bring us in a full fledged integration infrastructure, backed by Docker.
The Elasticsearch has grown from a Lucene evolution to a full fledged distributed document store, with powerful storage, search and aggregation capabilities. Kibana has definitely brought a strong component for interactive searching and visualization, transforming the data storage tier into an end user browser.
Customizable dashboards via a rich library of graphical components made its success, but soon, the need for real customization arose. If plugins were thought to be integrated from early on, the actual customization often lied into forking the master project and adapting to on particular purpose. Merging back fixes was soon to be a daunting effort to keep up with the high pace of the Github repository evolution .
Fortunately, as of version 4.3, the Kibana project took a more structured way to integrate custom plugins. The promise of maintainable external plugins became true. Those plugins, written in JavaScript, can be as simple as a standalone widget (e.g. a clock), a field formater (an up/down arrow instead of positive/negative number), a graphical representation of a search result (a chart) or a full blown application.
So, that should be easy. Just google and you would craft wonderful shiny visualizations.
But not fast, young Kibana Padavan! Documentation lacks, resources are valuable but scarce. But the promise is still shiny and we want to reach it.
In this post, we propose to share our journey into the writing of Kibana plugins, the little pitfalls we fell in and the setup of continuous deployment into a Docker environment. There is no dramatic discovery or stunning breakthrough today, but a tentative to write a map to make your journey easier.
The purpose of the Quest
The goals was to meet the Kibana 4.3+ promise, to be able to customize the platform without forking the orignal code branch.
Our *Definition of Done* was:
- we should develop different plugin types: independent widget, formatters, aggregation visualization. NB: at this stage, they don't need to be pretty or even particularly meaningful;
- they should be resizable and offer the classic comfort of the Kibana experience;
- we should be able to continuously build and deploy them via Jenkins or such;
- we want to use Docker to run Jenkins, Elasticsearch and an integration Kibana instance;
- with Docker, we want the infrastructure to start with preloaded data and visualization, to allow user driven or automated tests;
- we want the plugin development itself to be as smooth as possible (short reload time when source code has changed);
- we want others to be able to reproduce the experience;
- finally, we want to be able to give a feedback on which extent the technology is mature for a full blown project.
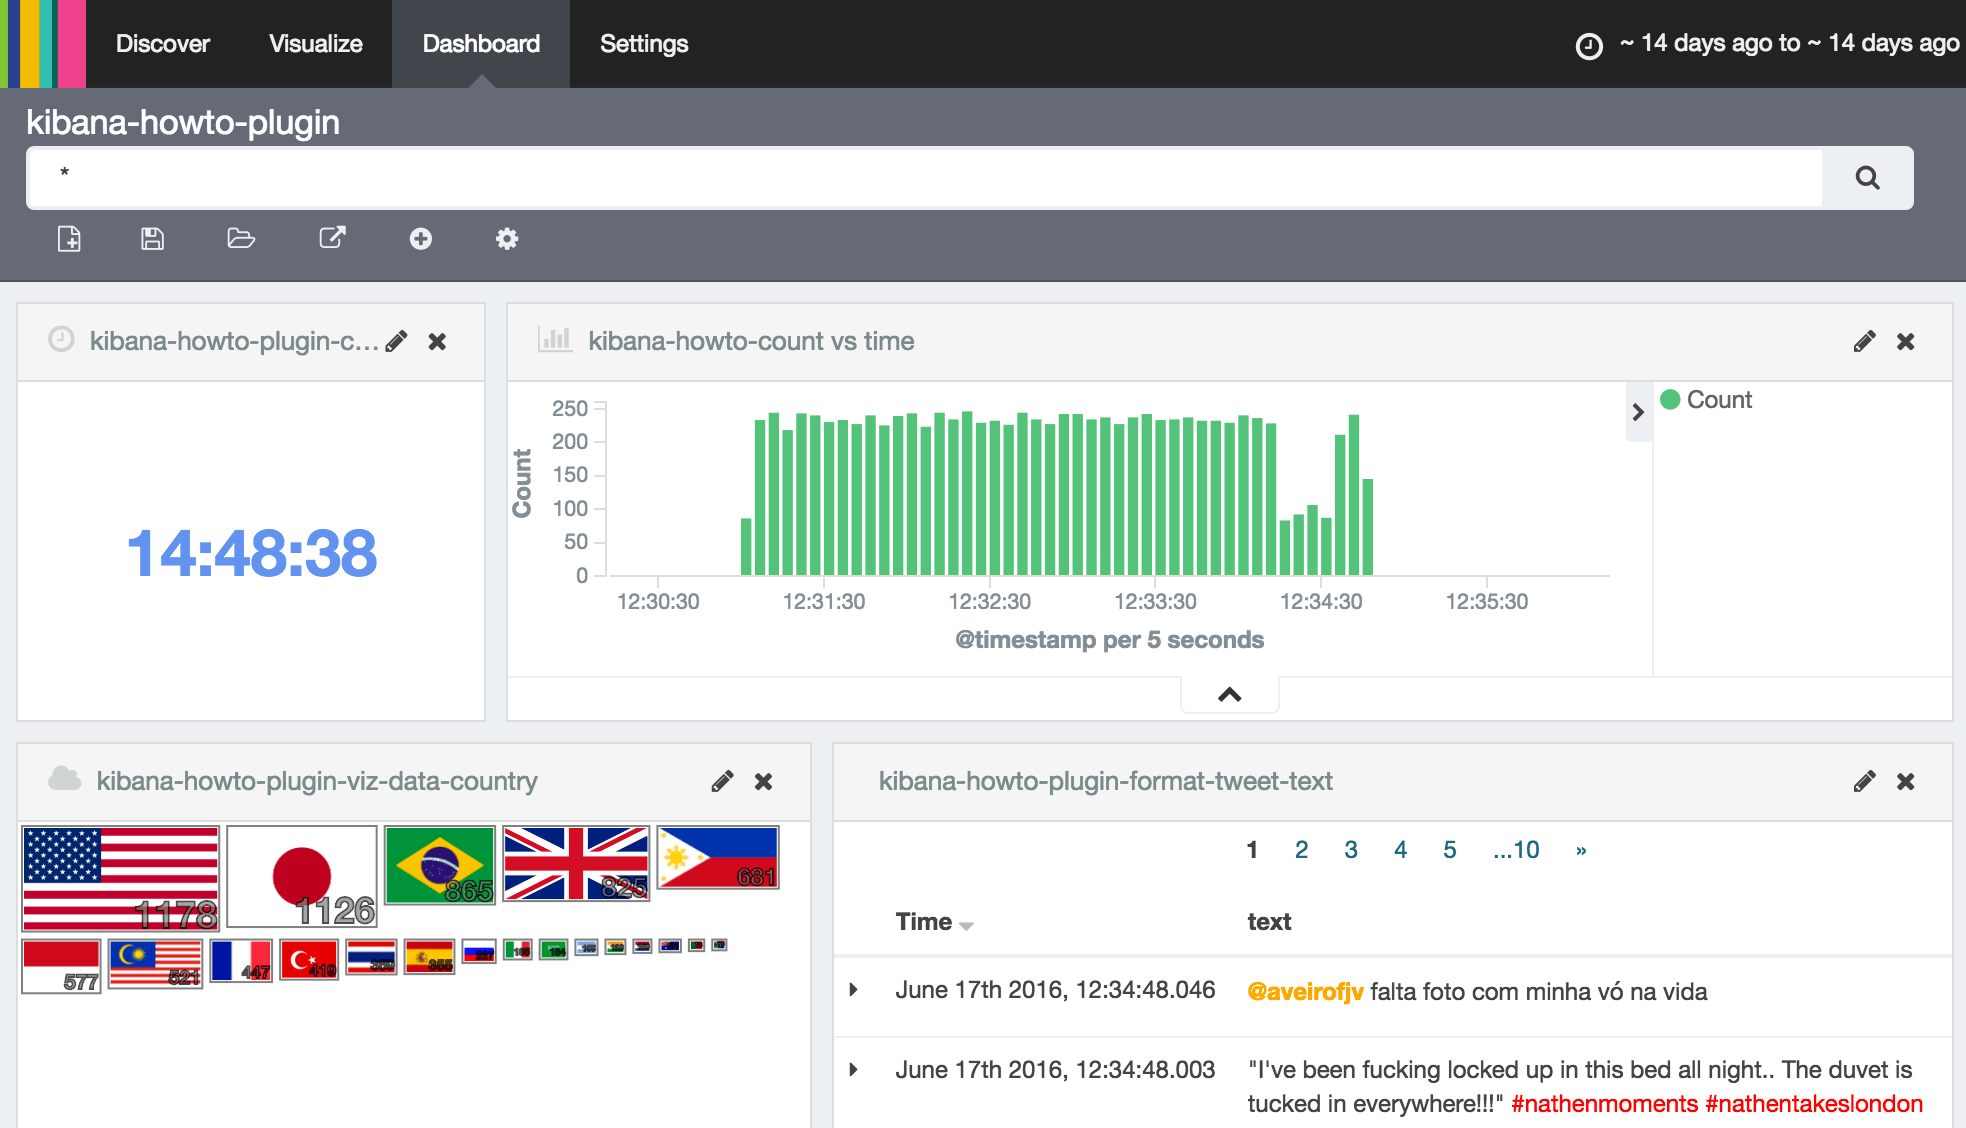
Figure 1: Elasticsearch is fed with 10'000 geolocalized tweets. We display a snapshot of the deployed dashboard with custom plugins. From upper left to lower right: a) a simple clock, untied to any data; b) the default Kibana date histogram, for time range selection; c) an aggregation visualization, where tweets are counted per country; d) a search results with a custom formatter, altering the color for #hashtags and @accounts.
Wasn't there any full detailed map available?
If only there had been one, this whole effort would have been a straight tweet: "amazing tutorial on how to build and deploy #kibana plugins #elasticsearch http://wonder.land/build/your/own/kibana/plugins." Obviously, none was found.
However, there were inspiring sources of information. Although some might have been incomplete, slightly out of date or simply flying at a too high level, we cannot thank enough their authors for having put us on track:
- enlightening talks from the ElastiCon conferences in San Francisco, 2015 and 2016. Way more blasting presentations are available there!
- the most comprehensive piece of documentation at the time and ubiquitously cited, a four parts post by Tim Roe. Although pretty descriptive, some information is missing, the committed code not fully working straightforwards (Kibana version?).
The Journey log book
For the impatient, head to Github, follow the instructions and run it on your laptop.
The architecture
To fulfill our quest, we need at least:
- Github repositories to host the plugins source code;
- a local development Kibana server, where plugins are refreshed upon saved;
- an Elasticsearch server, to store test data, and Kibana configurations;
- an integration Kibana, where packaged plugins are deployed canonically;
- Jenkins for continuous integration, to build those plugins and deploy them on the integration Kibana server.
For the sake of isolating an integration environment, we propose in figure 2 a Docker container set with Jenkins, Elasticsearch and the integration Kibana, while the development Kibana instance runs locally. This is of course only an example setup, but we believe it is sufficient to back our point.
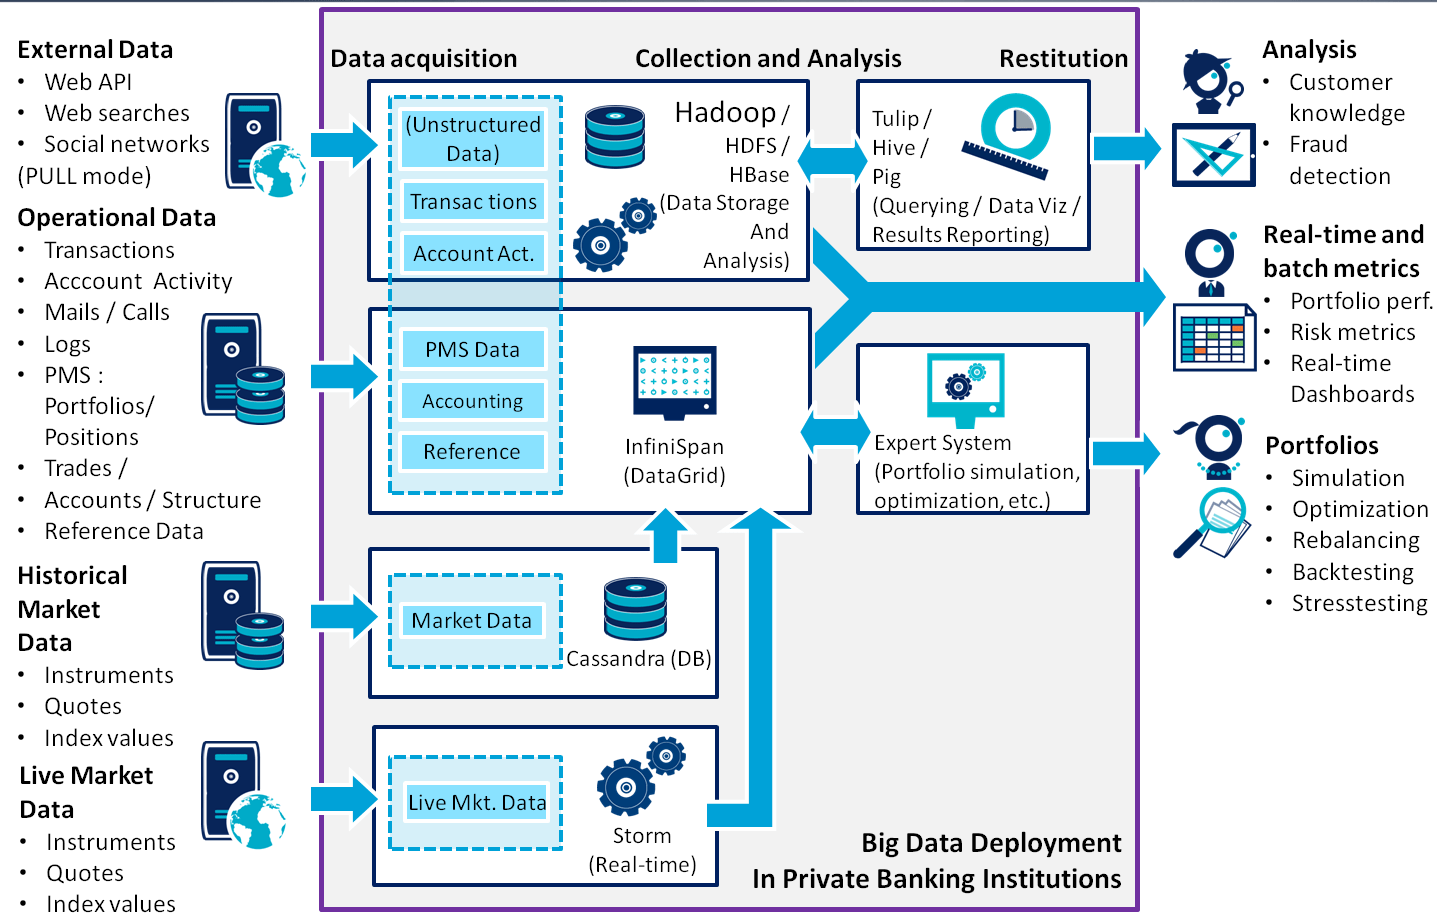
We will now walk through this architecture, see how to deploy it and how the initial data (a list of tweets) and configuration (Kibana and Jenkins) can be seeded.
Versions notes. As of writing, we used:
- kibana 4.4 & 4.5
- Elasticsearch 2.3
- Jenkins < 2
- NodeJS 4.4
- Docker 1.12 (both with VirtualBox 5.0.16 and Mac native)
Docker infrastructure
In this part, we will review how to launch a set of containers with the aforementioned services. If this part is rather classic, we will also see how we have populated each service with initial data, to offer the experience of an infrastructure ready to go_._
Docker is a powerful container platform to encapsulate lightweight containers. Perfectly suited for development, one can easily build upon pre-existing images (e.g. a Kibana v4.5.1), then custom them via DockerFile (e.g. tuning configuration). docker-compose brings the system even further, as it allows to generate a full set of containers linked by a private network, while some ports and volume are exposed to the outside world. In the age of micro services, we believe that lightweight container systems have deeply altered the developper's life. The project presented here is a typical example of such an architecture.
Spawning the infrastructure
First, install Docker locally, see Docker documentation for instructions.
To setup the continuous deployment environment for plugins development, clone the current repository:
git clone https://github.com/alexmasselot/kibana-plugin-howto-infra.git cd kibana-plugin-howto-infra
The configuration for Elasticsearch, Kibana, Jenkins and their relative dependencies are specified in docker-compose.yml.
Now the Docker container can be started:
export DOCKER_MACHINE_NAME=kibanahowto docker-machine create --driver=virtualbox --virtualbox-memory 4096 --virtualbox-cpu-count 2 --virtualbox-host-dns-resolver $DOCKER_MACHINE_NAME eval $(docker-machine env $DOCKER_MACHINE_NAME) docker-compose build echo "now start the machine and, when it's ready, open http://$(docker-machine ip $DOCKER_MACHINE_NAME):5601/app/kibana#/dashboard/kibana-howto-plugin?_g=(time:(from:'2016-06-17T10:30:12.574Z',mode:quick,to:'2016-06-17T10:36:14.545Z'))" docker-compose up
What have you just done???
You have deployed an Elasticsearch server, a Kibana and a Jenkins servers for continuous deployment. Demo data is populated in Elasticsearch and a visualization is available in Kibana through default dashboard.
To access the servers in the container, you can find the IP address of the docker-machine with the following command:
docker-machine ip $DOCKER_MACHINE_NAME
The different services are accessible here:
http://my_docker_ip:9200for Elasticsearch serverhttp://my_docker_ip:5601for a Kibana, or for a direct dashboard access:http://my_docker_ip:5601/app/kibana#/dashboard/kibana-howto-plugin?_g=(time:(from:'2016-06-17T10:30:12.574Z',mode:quick,to:'2016-06-17T10:36:14.545Z'))http://my_docker_ip:8080for Jenkins continuous integration & deployment
Allow a couple minutes for the data to warm up. Congratulations, you have setup the environment for continuous deployment of Kibana plugins!
Populating initial data and configuration
One of our goal is to boot containers with preloaded data and configurations:
- Elasticsearch contains 10'000 tweets with geographic coordinates.
- Kibana is available with default dashboard, searches, visualizations and plugins.
- Jenkins shows jobs ready to be ran. For each plugin, source code is pulled from Github repository, packaged and deployed to the Kibana server via ssh.
We believe that only seamless integrations process have a chance of being adopted by fellow developers. Remember Larry Wall (Programming Perl, 2nd edition, 1996): "laziness, together with impatience and hubris, is one of the three virtues of a good developer.
As mentioned earlier, the overall infrastructure is described in the docker-compose.yml file, while individual containers are instantiated via docker-containers/*/DockerFile. More information can be found on the Docker compose page.
The only original part here is how we actually capture and populate initial data
ElasticSearch (the tweets)
As mentioned before, we want to populated 10'000 geolocalized tweets, to demo our plugins.
Creating the set
A set is already available in the containers/elasticsearch-initial-data/data/tweets.jsonl file. To create such a set, a tweet-download.js NodeJS script is provided. In this script, the Twitter client registers to a stream, filters messages with a location field, adds a timestamp field and appends each of them as a JSON object in the tweets.jsonl file.
Edit and source a secret-env.sh file with your API keys. Refer to the Twitter API to discover more.
Uploading the set into Elasticsearch
The containers/elasticsearch-initial-data/entrypoint.js contains call to the Elasticsearch API.
The only pitfall to avoid was to wait for the ES server to be up, and only populate the tweets, at start time, only if they are not already in. As the ES container can be started several times, we obviously want to push the data only once. This check is achieved via a couple of search call to the API.
Kibana
The first step is to install an initial version of each of the three plugins at building time. As those are not yet available through our continuous integration component, we cheat and install them directly from Github via the containers/kibana/entrypoint.sh.
The second step is to set tweets as default the index, create the demo searches, visualisations and dashboard.This is done populating Elasticsearch indexes from a priori saved data, and is actually achieved by the ES data instantiation step.
The last step is to import mappings, searches, visualization and dashboards, in order to have Kibana already setup when opening it the first time. As for the tweet data, those features are conveniently stored in a .kibana index in Elasticsearch. But here is a chicken and egg problem: we needed to create a dashboard, in order to save it, in order to download it. Initial configurations had to be built at once by hand. A script to save them is available: containers/elasticsearch-initial-data/dump/kibana-download.js.
Jenkins
Being file based, Jenkins configuration consists in deploying a snapshot. However, we face again another chicken and egg problem...
We solved this configuration issue by mounting the /var/jenkins_home directory in Docker (docker-containers/jenkins/data/jenkins_home).
Then, the Jenkins itself was configured, jobs added, plugins installed through the classic web interface as the change are persisted in /var/jenkins_home, thus in the git repository.
The key point is to avoid polluting the Github repository with thousands of generated files (job runs, log, etc.) They were generously excluded via the .gitignore file.
Why a chicken and egg pattern
For both the dashboard and Jenkins, we follow the same pattern:
- set up the tool by hand (typically via its web interface);
- export the configuration and commit to git;
- re-import the saved configuration when deploying new instances;
- to modify the setup, go to 1.
This approach can be challenged. Why not using ex nihilo setup creation? One could read the Kibana or Jenkins configuration documentation and build up the desired instance. This approach is encouraged, specially for Jenkins, where a documented API exists.
Opting for a programmatic creation will ease collaboration of multiple developers. Moreover, merging generated and cryptic JSON configuration files can prove to be a challenge in itself...
However, the chicken and egg pattern offered us a gain in time and flexibility.
Writing custom plugins
At last, we talk about plugins! Sorry for the impatient, but we had to set the infrastructure up first. Get the toolbox ready and start building seemed pertinent.
We built three plugins above our tweet data, strongly inspired (when not shamelessly forked) by the four parts blog post by Tim Roes (see figure 1):
- a clock (Github), simply forked out from Tim's, except for the packaging mechanism (in
package.json) leveraged with the other examples; - a string field formatter (Github), which turns
#hashtagsand@accountsin different colors; - a search result graphic visualization (Github), where the filtered tweets are counted by country, and a flag displayed with a relative size. This view is more complex than the previous one, using AngularJS and d3.js.
As there is nothing particularly original compared to other available resources, we won't dive into plugin intricacies. We will only point out some implementation hints that we found either lacking or unclear.
The development process
The good part about customizable plugins is that one should be able to... customize them. And preferably in a smooth way. One solution is to:
- modify the code;
- push modified code to Github;
- launch a Jenkins job to pull/package/distribute it;
- head to the Docker Kibana server to see the changes.
This easily take a couple of minutes, which can hardly be quoted as "smooth" by the XXIth century JavaScript standard.
The other solutions is to work locally (on the developper laptop):
- install at once Kibana and launch it in development mode;
- fork or clone at once the plugin source code into the `installedPlugins/` directory;
- modify the code;
- refresh the local browser to see the modifications;
- go back to step 3;
- only push the code to Github when a meaningful step has been achieved.
The 3-4-5 feedback loop is way faster than the first method (even though refreshing the browser can take up to ten seconds.)
A few practical hints
Tim Roes and others have explained in great details the nuts and bolts of writing plugins. However, some information was not readily available to go further than the hello world stage. We propose here a few hints to avoid common traps in the journey of writing production ready plugins.
Resizable components
It seems obvious that components rendering should often adapt to their size.This is even more true with Kibana customizable dashboards. Although this feature is ubiquitous, little has been written.
The common underlying library to build visualization components is the versatile AngularJS. The watcher mechanism allow to regularly watch the widget dimension and redraw when needed. Even though this solution is often proposed, it only partially works. When moving around and resizing a full dashboard, the watcher function can be called too many times simultaneously, leading to exception generations. Beside being a poor programming pattern, the user experience can be impacted.
An more elegant solution is to listen to some resized event, but little information was available. The solution can from diving into Kibana source code and locate the change:vis event.
Then, the implementation comes to (if render is your actual component rendering function):
rootScope.$on('change:vis', render);
You said "AngularJS"?
Basing plugin code on AgularJS certainly is a maturity choice and one could be attracted by recycling prior knowledge on the framework.
If it can be seen sometimes as an inconvenient, AngularJS is strongly opinionated, splitting an application into functional modules, organized in controllers, factories, services and directives. Above this architecture, its success is certainly correlated to a versatile ecosystem and the easiness, for example, to isolate components and write tests.
Unfortunately, most of the popular examples we found on Kibana plugins do not take advantage of the proposed split of concerns and add too much functionalities (such as rendering) into the controller.
However, nothing seems to intrinsically make a proper AngularJS decoupling impossible. Our conclusions are only based on this experience, where we may have left the battle too early.
Packaging a plugin
Packaging a plugin consists in building a deployable .zip archive.
Although several methods are proposed by various authors, we converged towards the @elastic/plugin-helper module, allowing npm run build . Once the zip archive is packaged, it can either be made available on a url (Jenkins published artefacts) or copied to the kibana server.
The plugin deployment itself is achieved by sshing onto the server and executing a /opt/kibana/bin/kibana plugin --install ...
To have more specifics about those command, the easiest way is to head to Jenkins an open the configuration of one of the kibana-plugin-*-deploy jobs.
So, shall we use customizable Kibana plugins?
Or "shall we write an independent classic rich web application, backed by a REST API on top of ES?" The short answer is: "yes and no."
The Elasticsearch+Kibana stack certainly deserves its success. And a huge part of it is due to the versatility of Kibana visualization, with default and community plugins already available.
Pushing the dashboard further on seems natural. Then, turning the default exploration tools into an open production front end seems an appealing and inexpensive solution, compared to writing a full rich web client from scratch.
This choice can make sense up to a certain limit. Customization comes to often underestimated costs:
- the major one is the Elastic development velocity. It goes fast, and architectural changes (minor or major) are often not backwards compatible. Kibana 3 & ES 1.7 have been adopted at large and the pace of changes is hard to follow for developers. Elastic 5 coming down the corner will keep us rocking for sure.
- As a corollary to the previous point, if the stack is not mature, resources are scarce and answers often diverging.
- The plugin development itself, even as presented in this article is not radically smooth. In development mode, the lead time for a minor change ("just modify this css width") to reach the screen takes a few (easily up to ten) seconds and makes the process cumbersome compared to today standards, where we are more used to have screens refreshed within a second.
- Tying up a whole project architecture to the Elastic perspective can make sense if we are ready to follow all their choices and willing to pay extraordinary prices for customization (stepping sideways for authentification, for example)
Those costs taken into account, it may often not seem totally unreasonable to head towards an independent front end development, backed by classic stack such as AngularJS, or even better for the topic at hand, ReactJS + flux application.